Layouts to Input data
We use “INPUT: xxx” - layouts when the “ALL: xxx” – layouts are not best suited to record data in records of a table in the database. Often the layout shows related data so the new recordings can be judged in context.
- Vintage Dates & Berry Maturation commentaries are recorded using the “INPUT: Vintage Dates & Berry Maturation Comments” - layout
- Berry Test data are recorded using the “INPUT: Berry Tests by Test Date” - layout
- Harvest Actions are recorded using the “INPUT: Harvest Actions” - layout
- Fermentation Actions are recorded using the INPUT: Fermentation Actions by Harvest” – layout
- Composition of Cellar Batches are defined in the “INPUT: CellarBatchComposition” – layout
- CellarBatchCollections are defined in the “INPUT: CellarBatchCollections” – layout.
- Cellar Batch Actions are recorded simultaneously for multiple Cellar Batches using the “INPUT: Cellar Batch Actions by Collection” - layout
INPUT: Vintage Dates & Berry Maturation Comments
As we monitor the weather and the maturation of grapes in the vineyard, we estimate and revise berry test dates and harvest dates for each block. We use the “INPUT: Vintage Dates & Berry Maturation Comments” – layout to record these dates and comments thereon. The layout is driven by the BerryMaturation-table and links to 8 instances of the Weather-table (one for each possible BerryTestDate) and 6 instances of the BerryTestAction-table (one for each vineyard block). The following graphic illustrates these relationships

Note: Later on (see below) we use the “REVIEW: Weather & Berry Maturation” layout which relates to 12 additional instances of the BerryTestAction table (one for each Harvest Block and BerryTestDate, and one for each HarvestBlock and FinalTestDate).
We use the “INPUT: Vintage Dates and Berry Maturation Comments” – layout to input the key dates and times for each harvest block in each vintage: Harvest blocks are hard-coded for the time being. The key dates are: a) start of Bud Break, b) start of Flowering, c) mid-Veraison, d) anticipated Berry Test dates and e) estimated or final Harvest Dates and Times. The table computes days elapsed between Flowering and Bud Break, between Mid-Veraison and Bud Break and between Harvest and Mid-Veraison. The data input must be completed before results of Berry Test can be recorded. As Berry Tests are recorded, key data (Brix, Total Extractable Anthocyanins) are displayed next to the test dates to deciding on the Harvest Dates
The following two screenshots show the layout first with field names and then, for example, the record for the 2017-vintage around October 9 (by when 6 sets of Berry Tests had already been recorded).
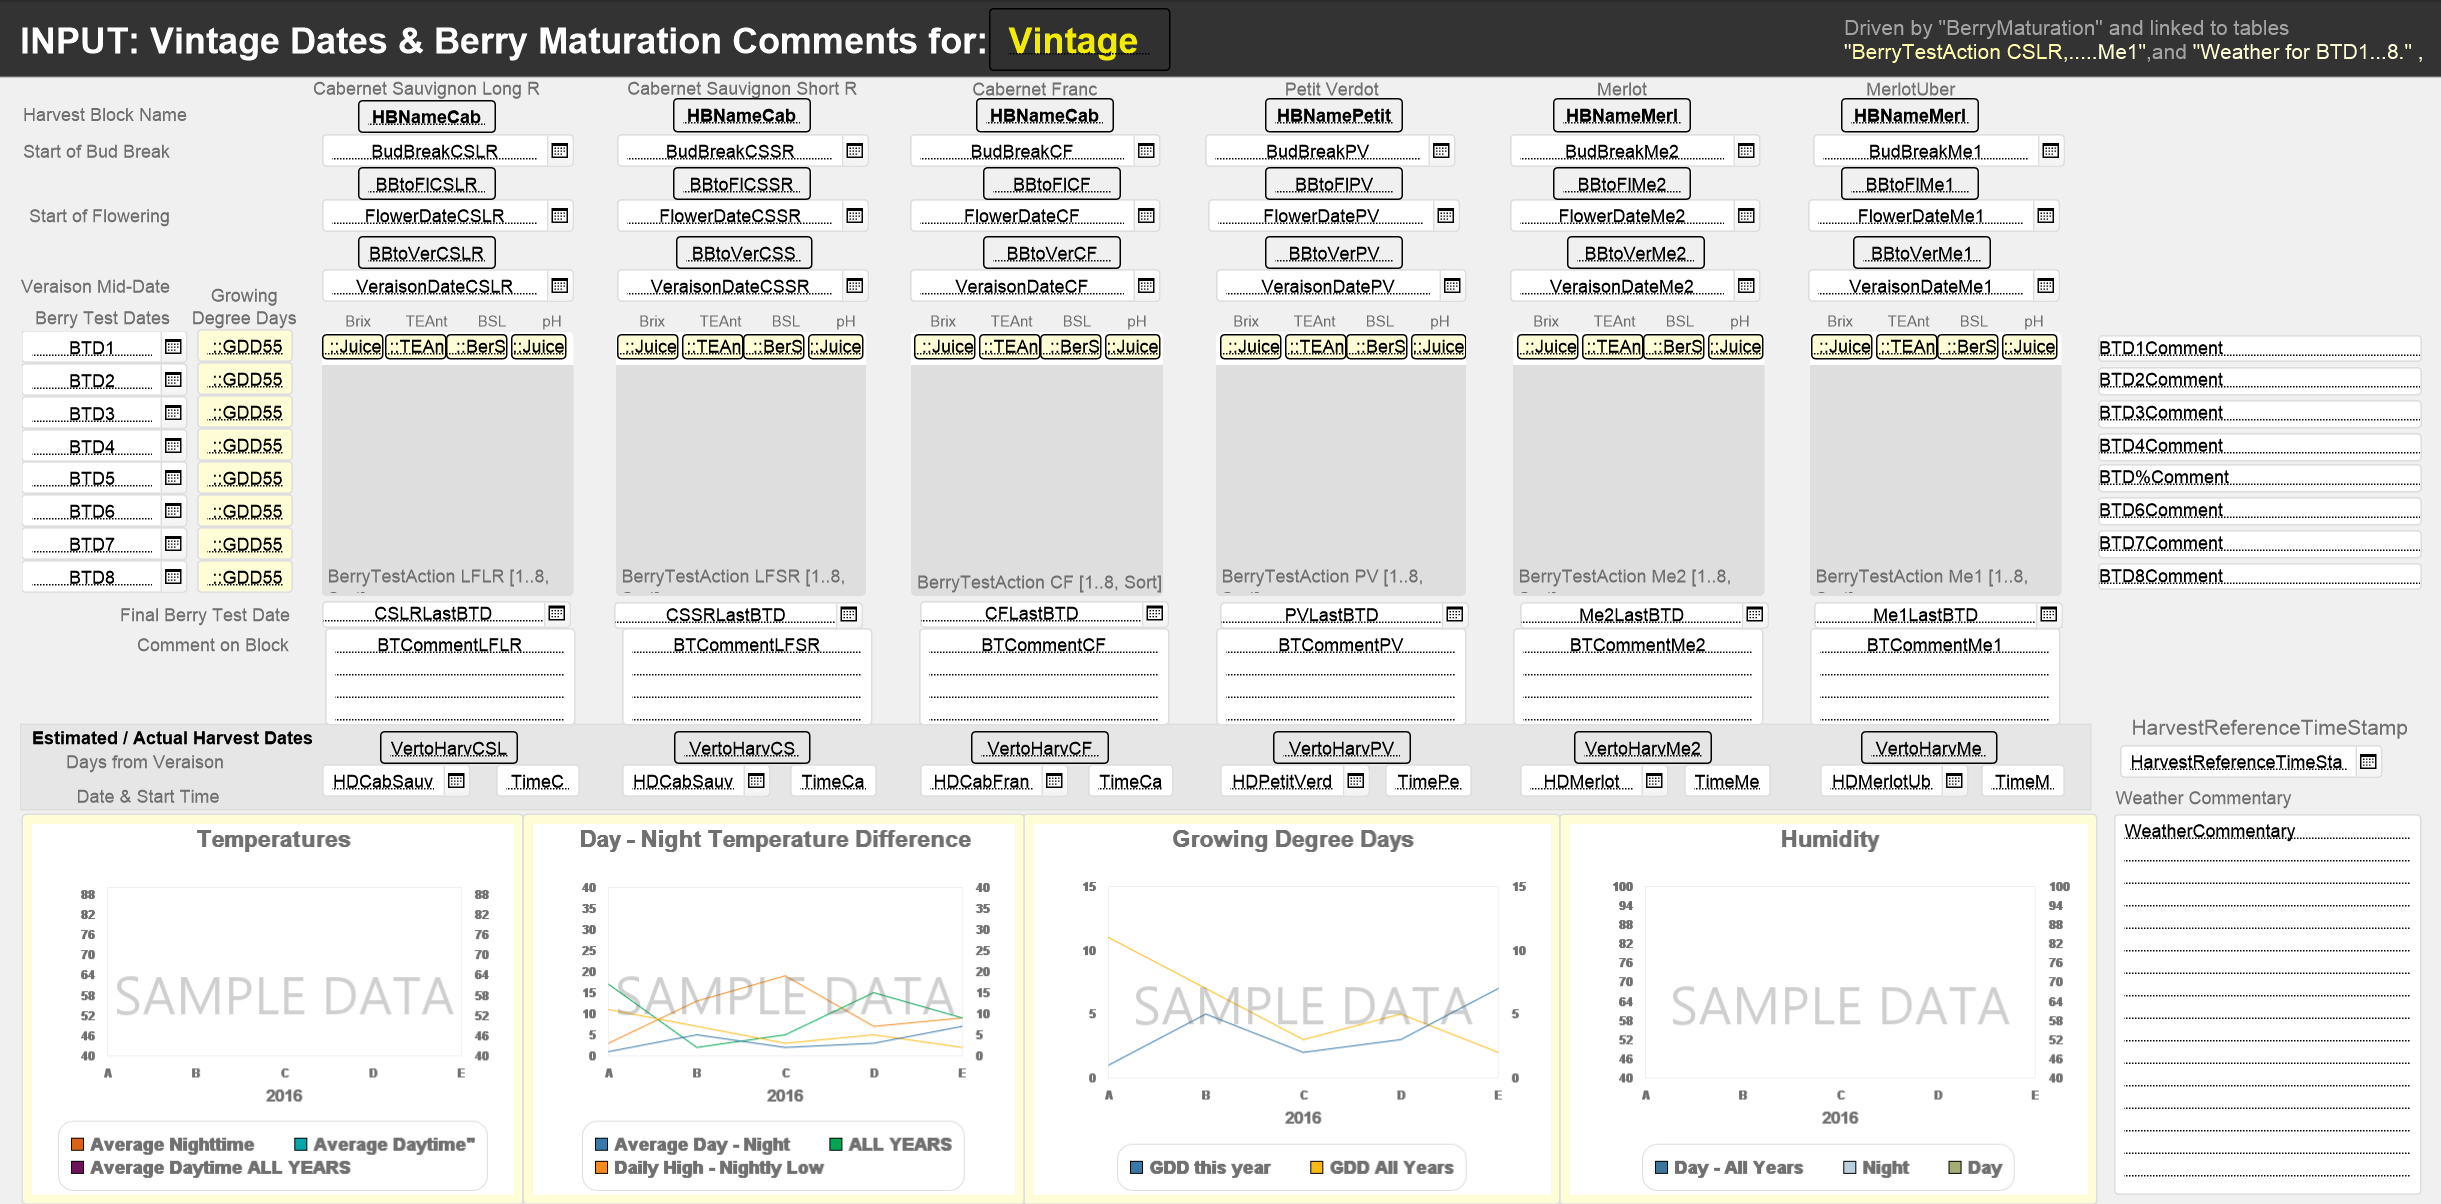
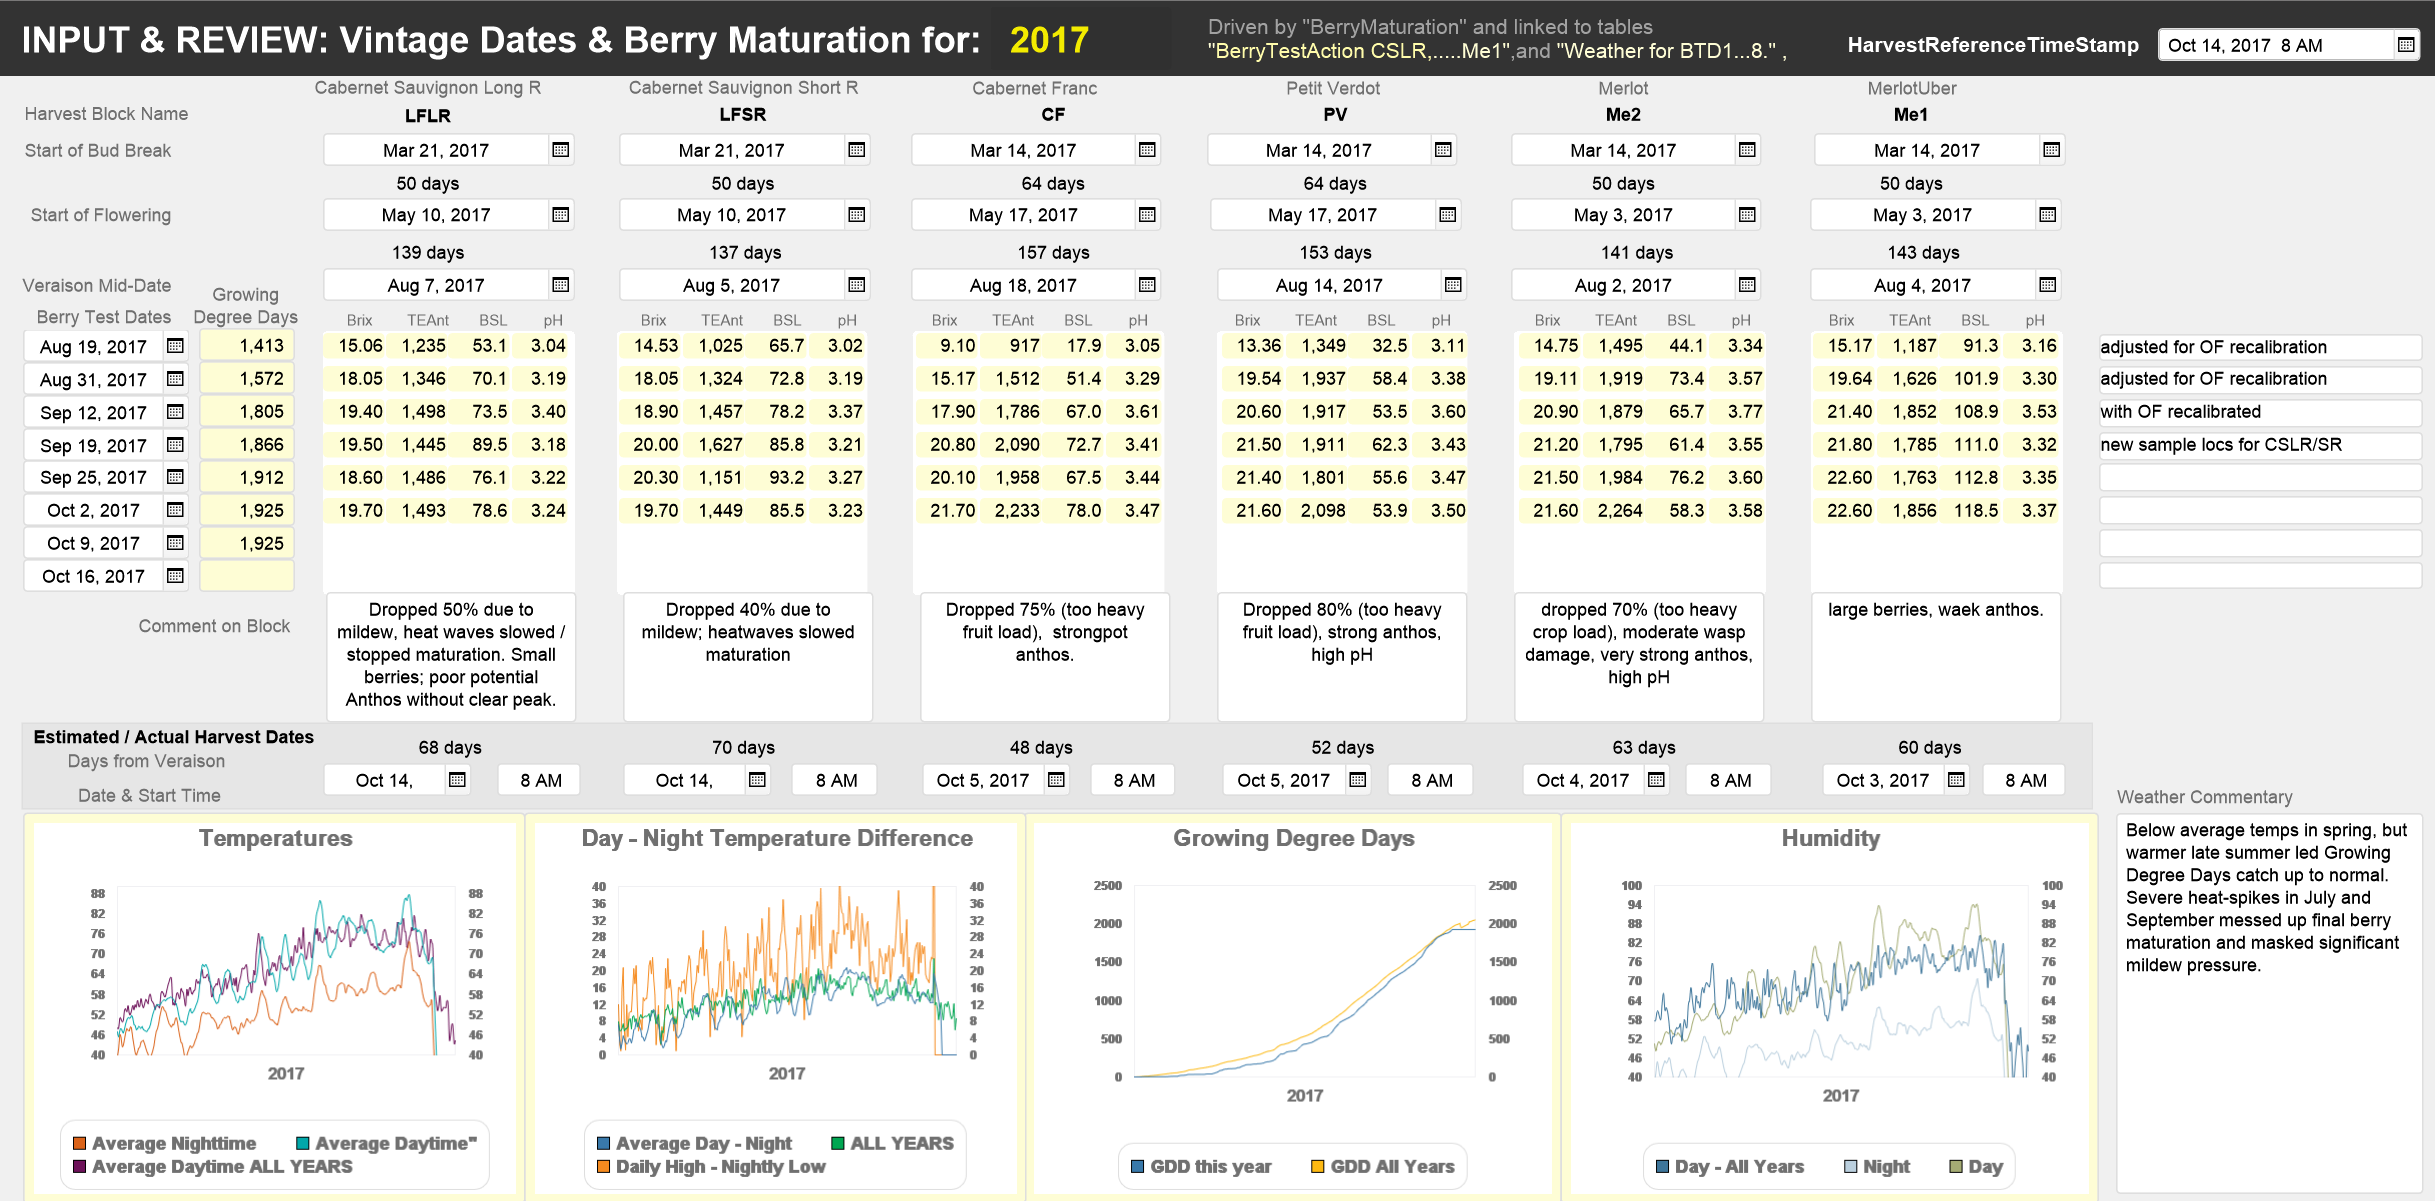
When we have decided on when to harvest each block (i.e. Harvest Day), we add the date on which the final berry test was taken, and we add commentaries for each block.
INPUT: Berry Tests by Test Date
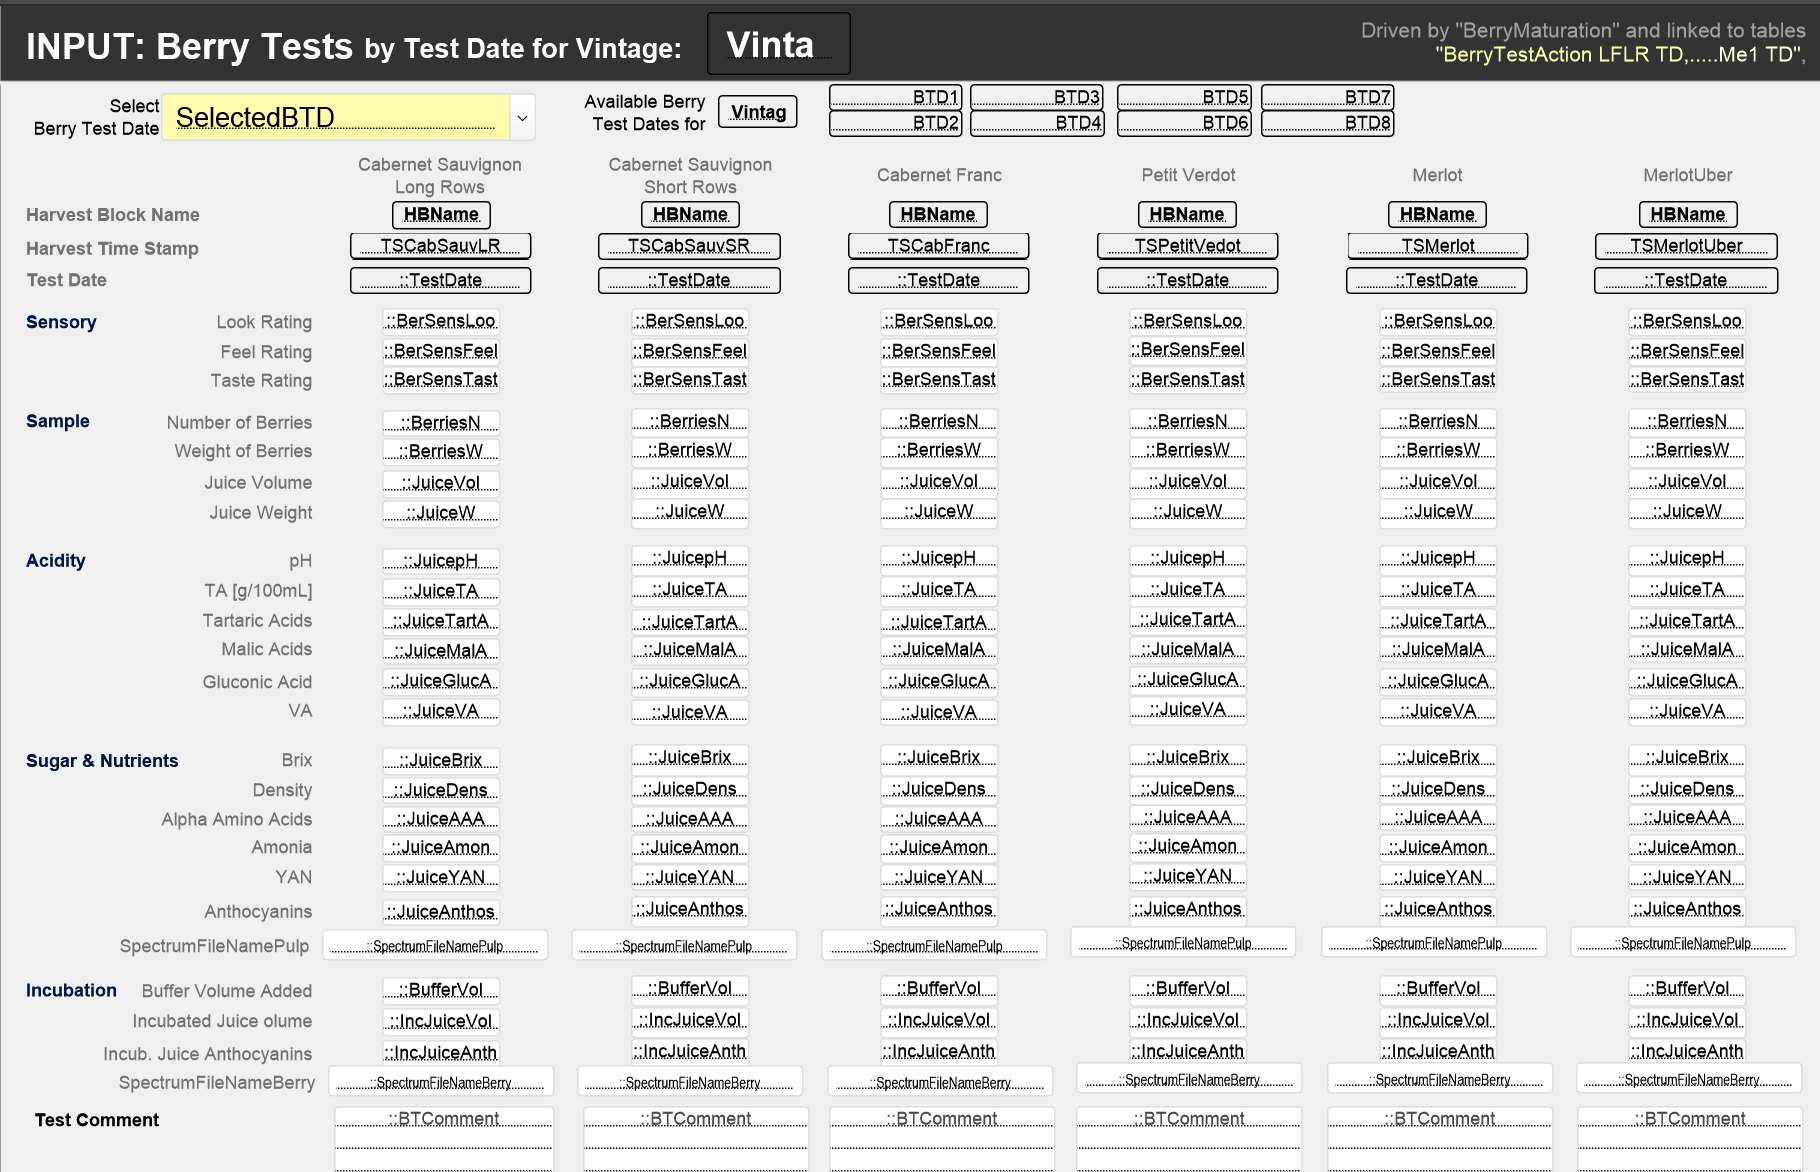
The layout “INPUT: Berry Tests by Test Date ..” illustrates how the relationships allow simultaneous recording of berry test data on a given test date for the six different vineyard blocks. The layout is driven by the BerryMaturation-table which links to 6 different instances of the BerryTestAction-table (one for each vineyard block)
For each of the 6 berry tests in the laboratory we record a) the sensory ratings, b) the sample size, c) acidity measures, d) sugar and nutrient levels and e) Anthocyanin estimates. Note, before Berry Test results can be recorded, BerryTestAction records must have been created (see CREATE: BerryTestAction). Detail descriptions of the fields will be added to the website later.
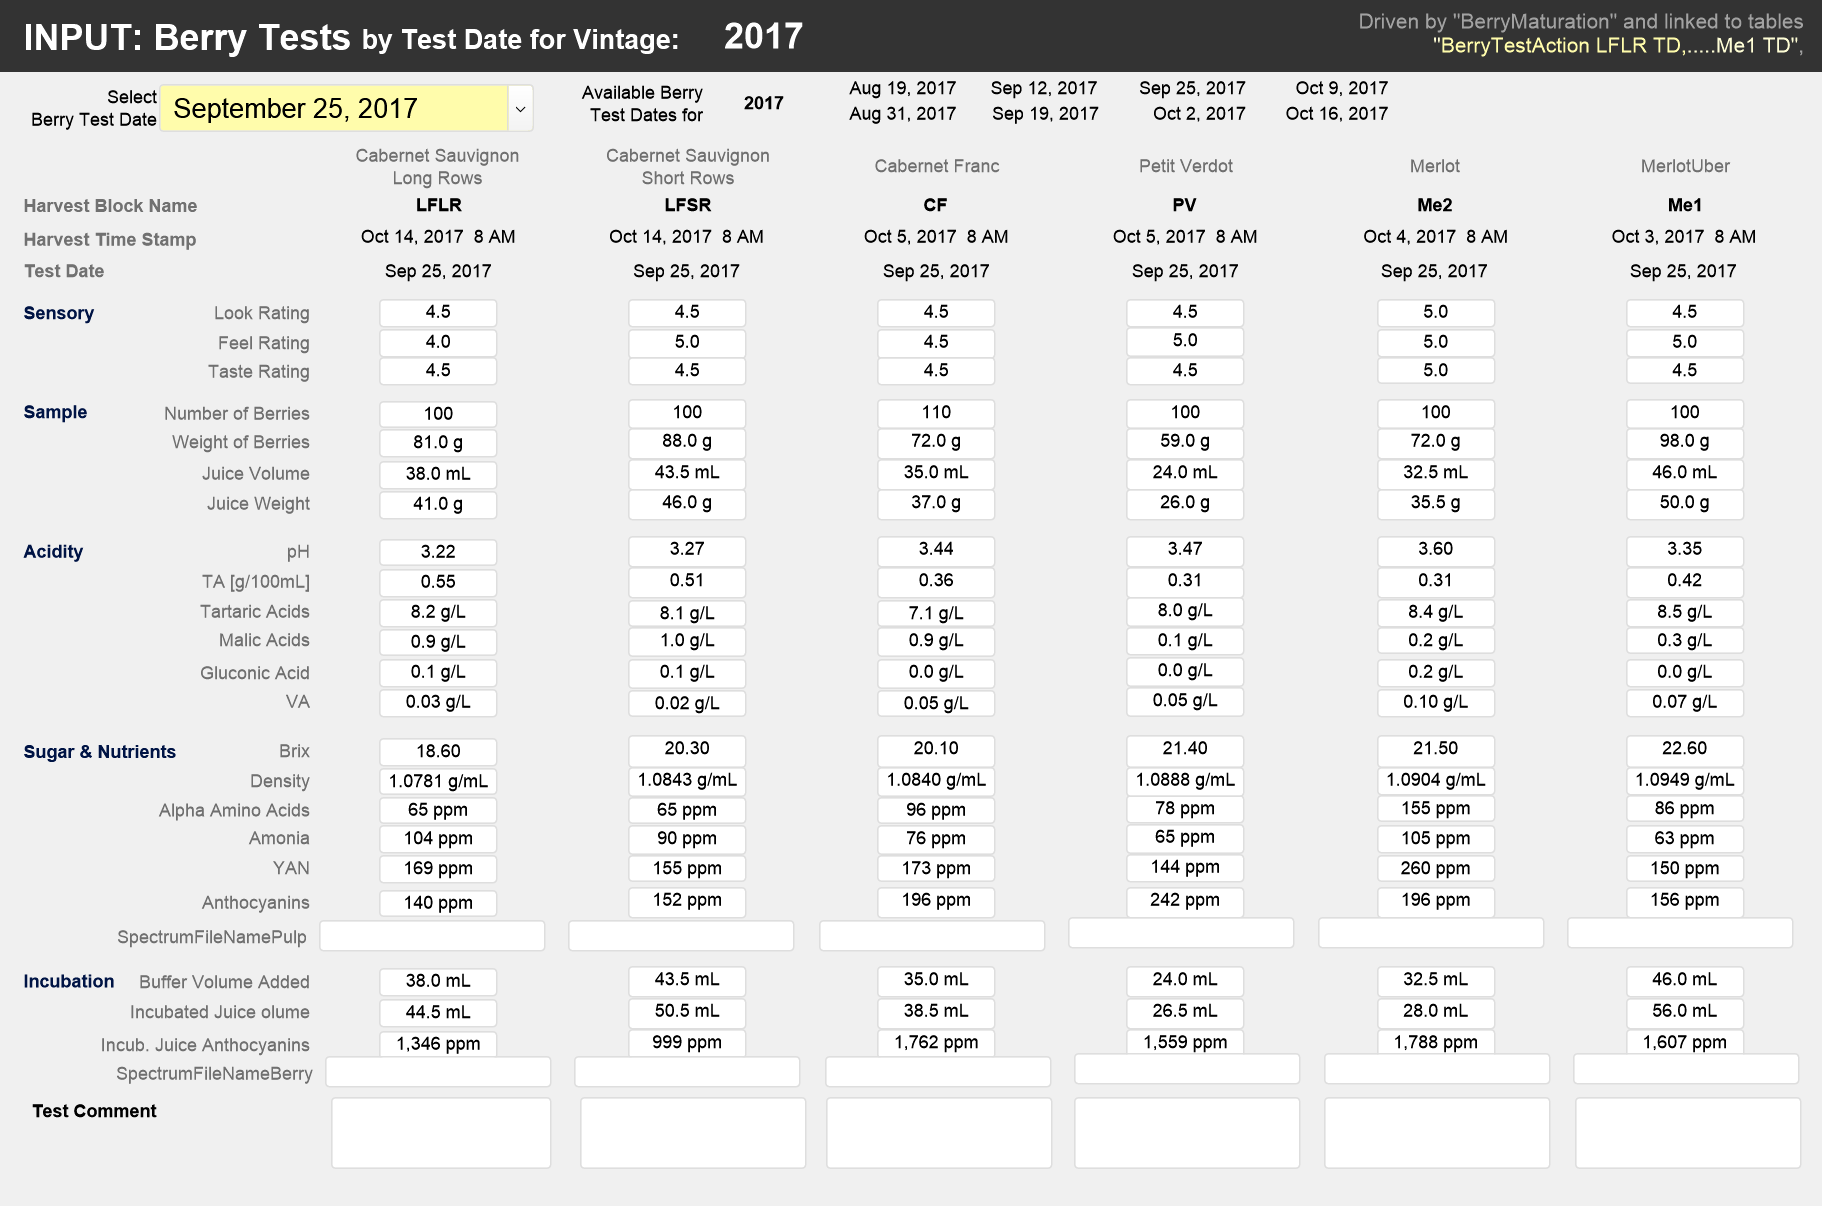
The following screenshots show the layout with field names and, for example, the record for the Berry Test recorded on September 25, 2017.
INPUT: HarvestActions
We may have one or two harvests per year, one for the upper field as it’s varietals mature earlier, the other for the lower field. We use this layout to record for each harvest:
- the size (i.e. pounds of bunches harvested) of the harvest per plant or row,
- the sorting waste per harvest block (bunches left in the field, bunches sorted out on the sorting table, stems separated in the destemmer and berries, juice and other material sorted on the vibration table, and
- the allocation of the net yield to different fermentation batches

To support the decisions for allocating the must to the different fermentation tanks, the HarvestAction-table links to an instance of the BeryMaturation-table.
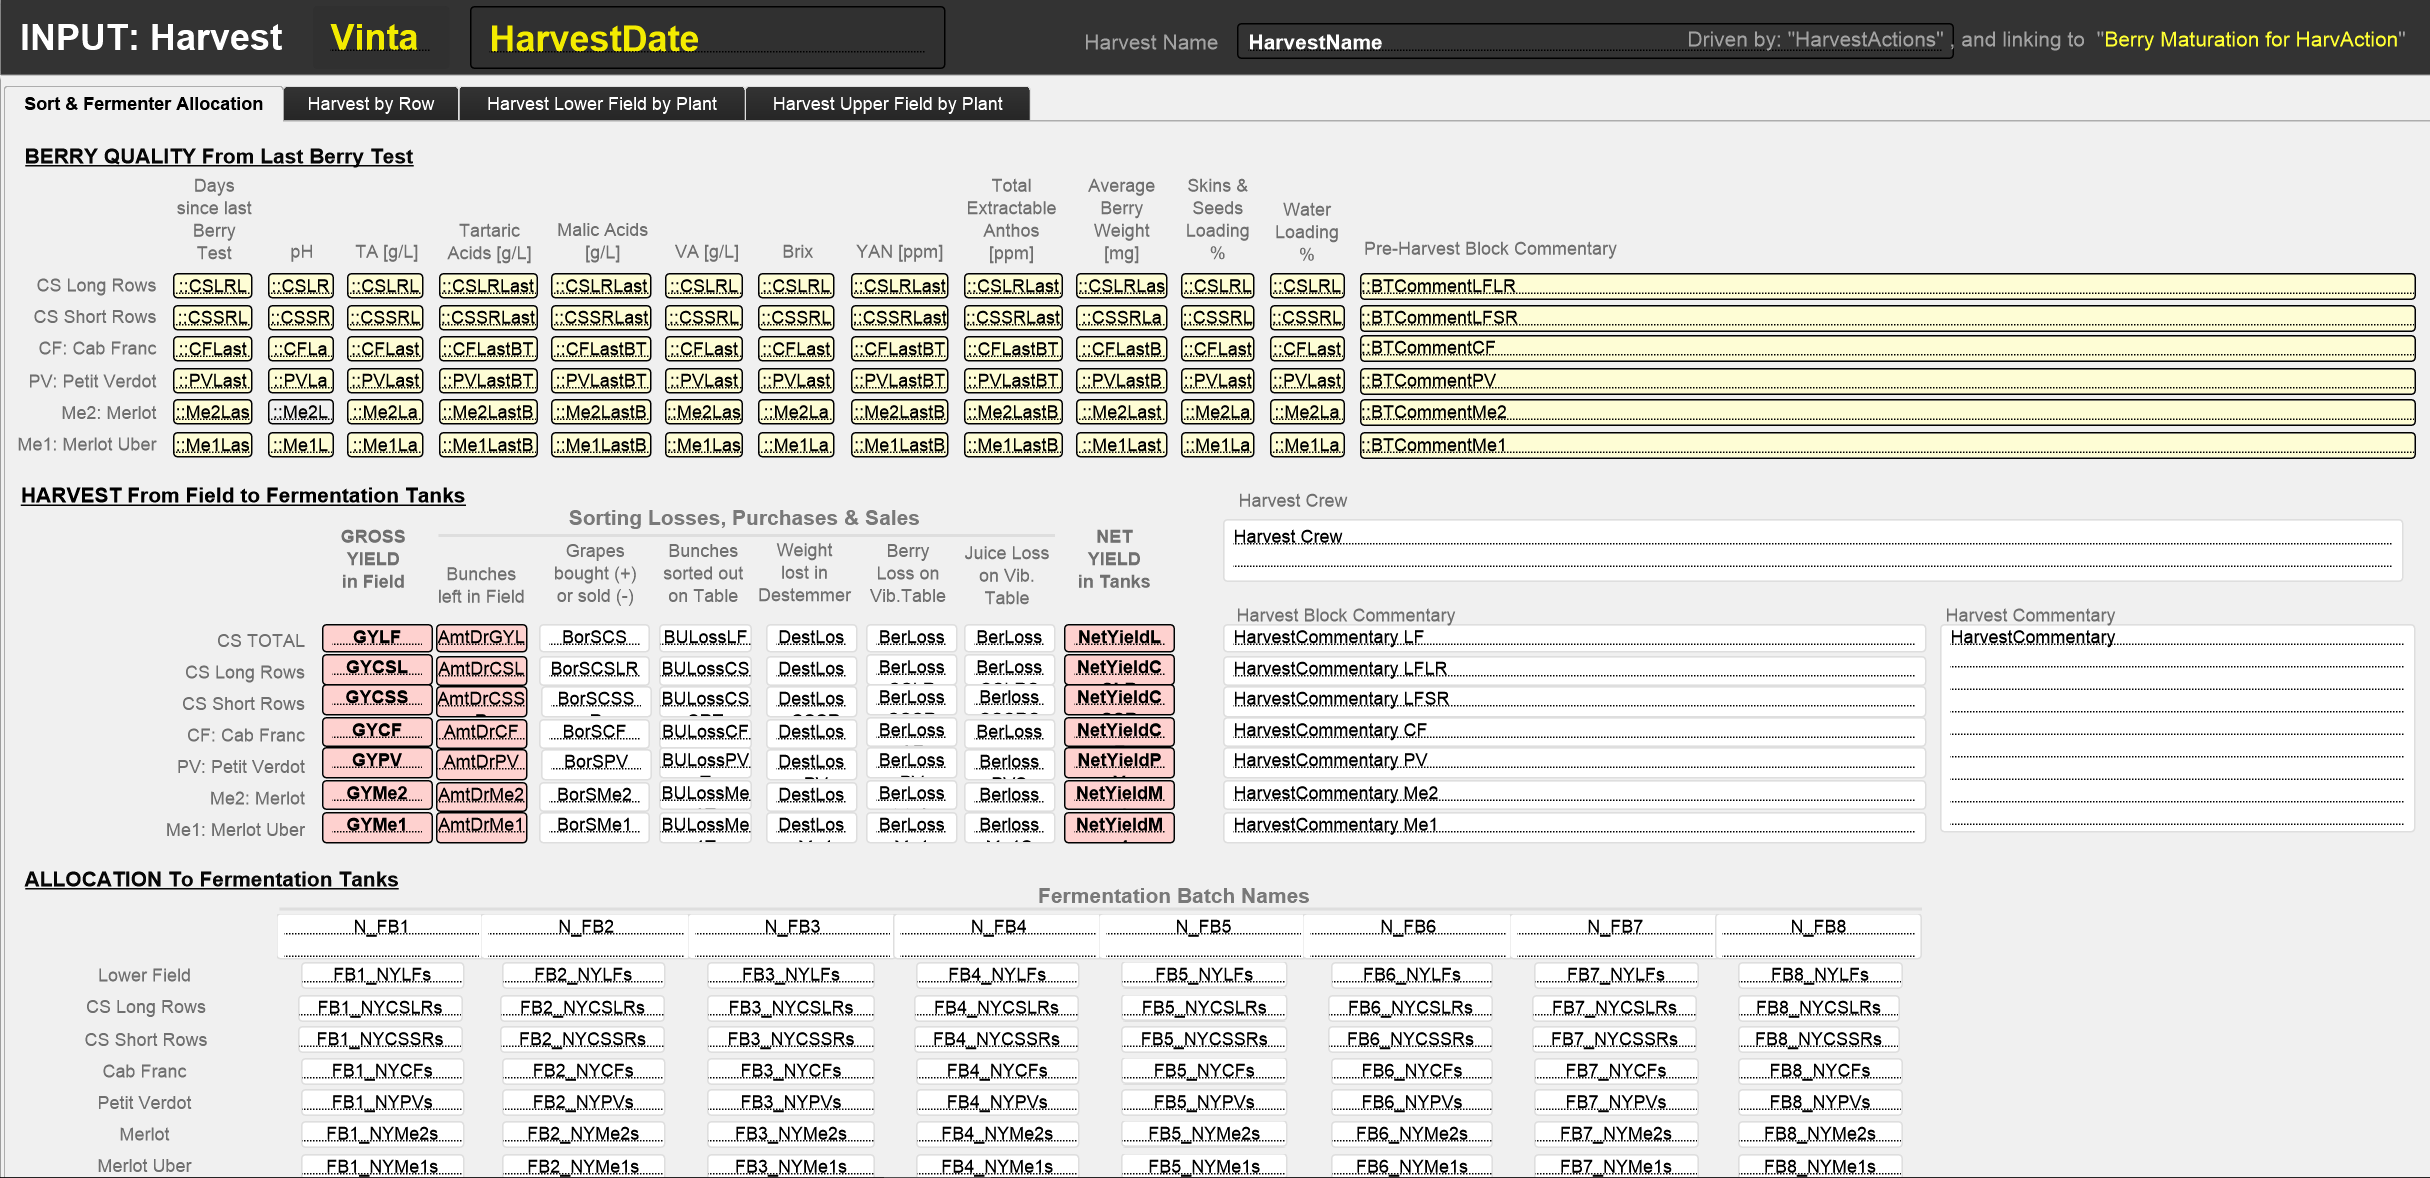
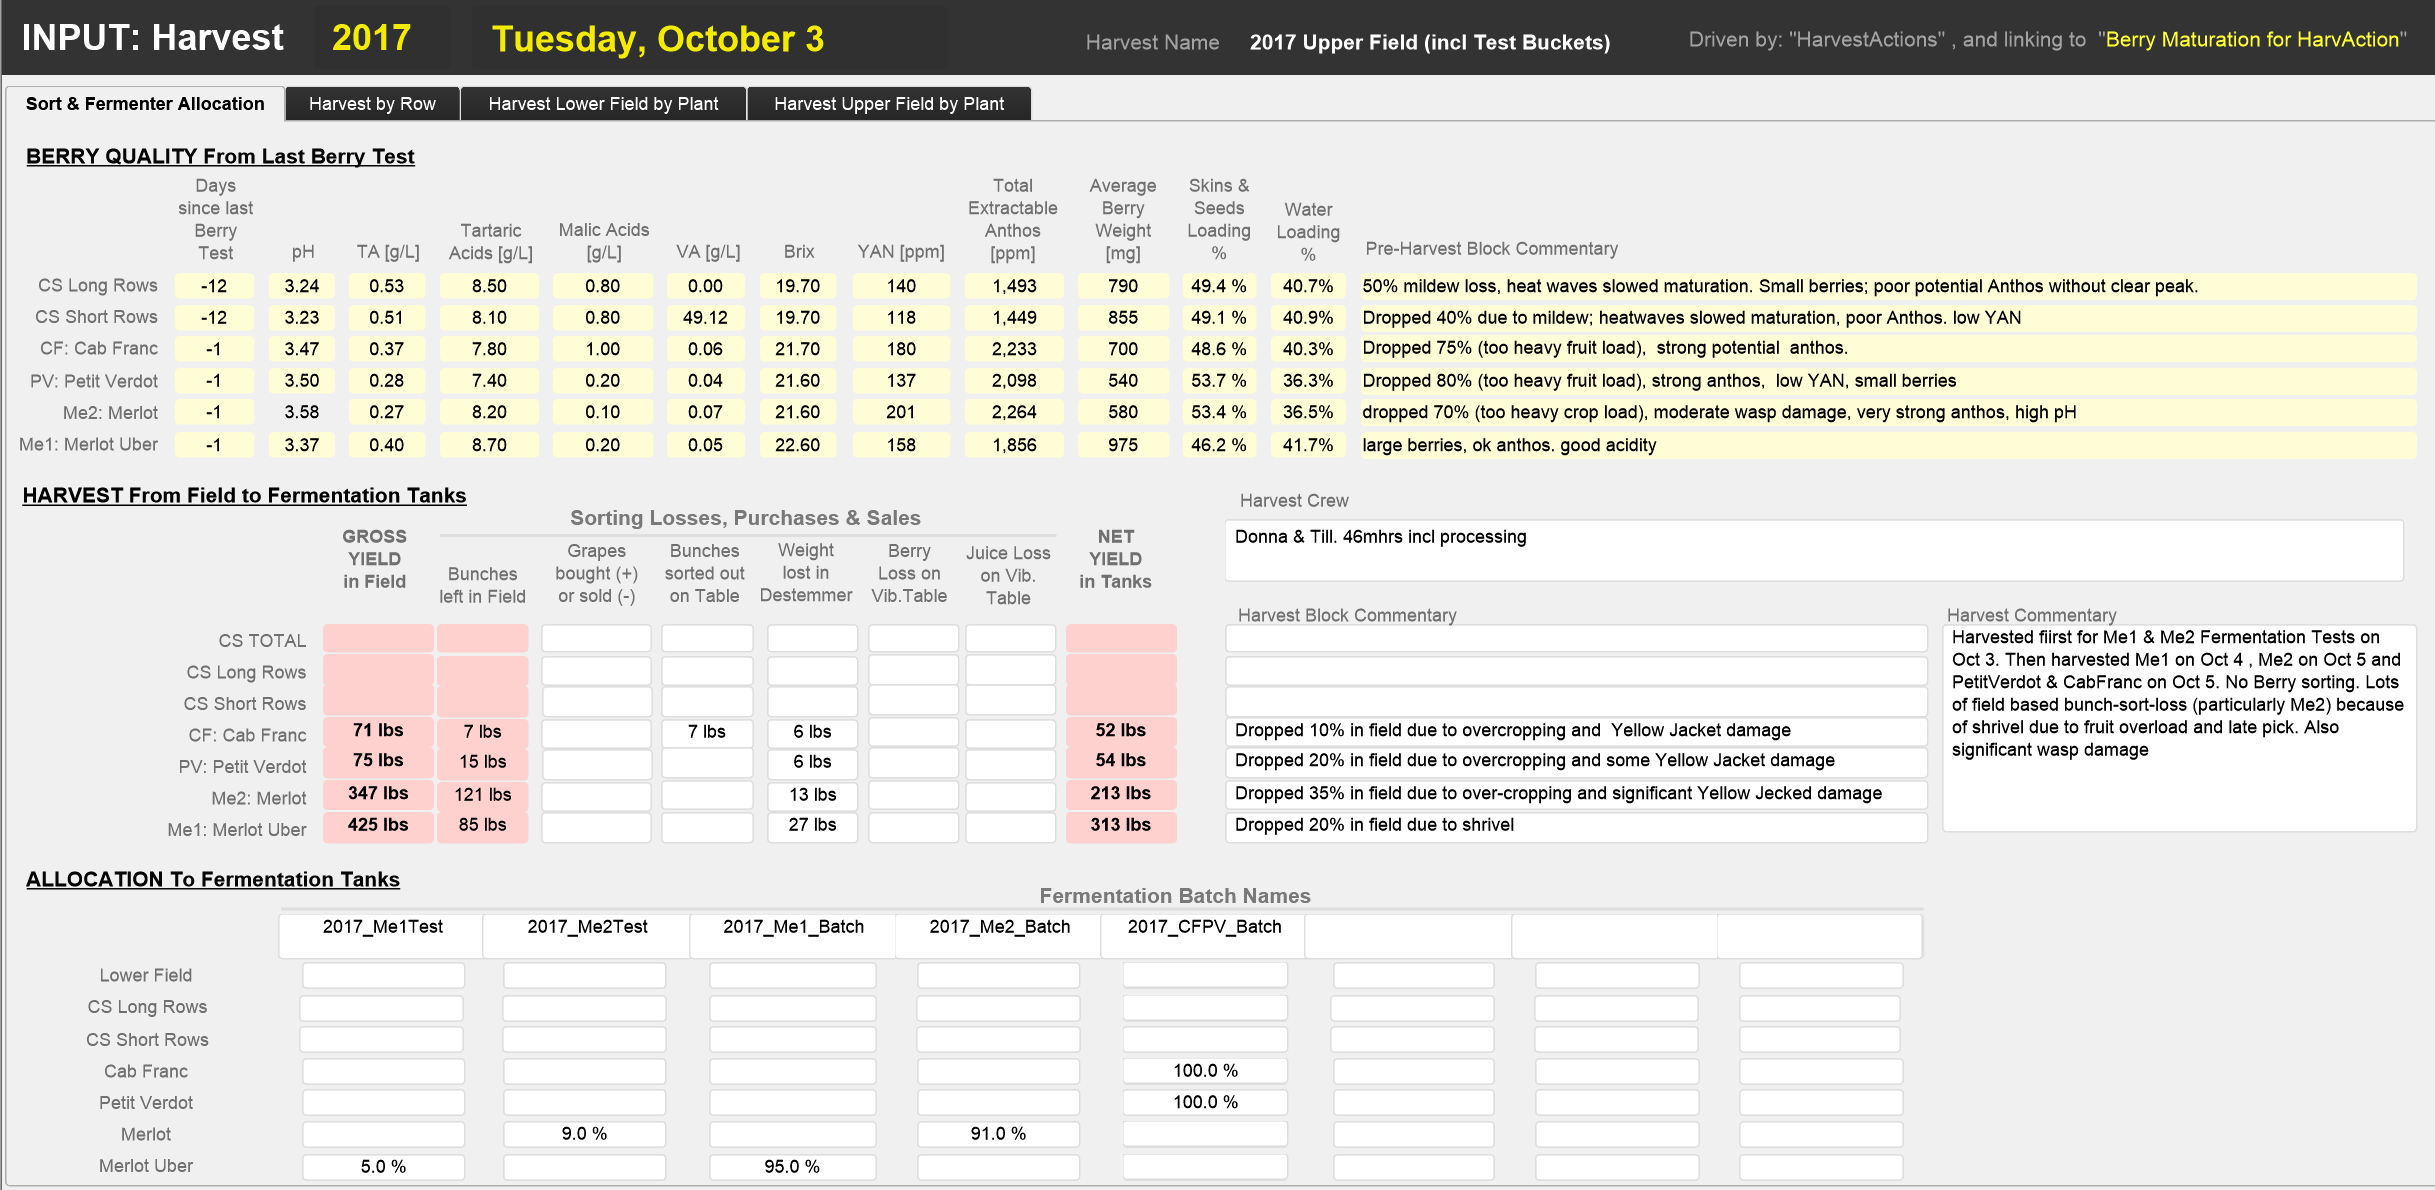
Because of the large amount of data, this layout has 4 tabs. The first, labelled “Sort & Fermenter Allocation”, reviews at the top the key data from the final berry tests. In the middle is the summary of the yields and sorting waste per harvest block. At the bottom is the input how the net yield is allocated to different fermentation batches. Note, before this last table can be used the respective fermentation batches have to be defined in the “CREATE: FermentationBatchDefinition” – layout. A detailed description of the fields will be added to the website at a later time.
The following screenshots show the first tab of the layout with the field names and, for example, for the harvest of the upper field on October 3, 2017
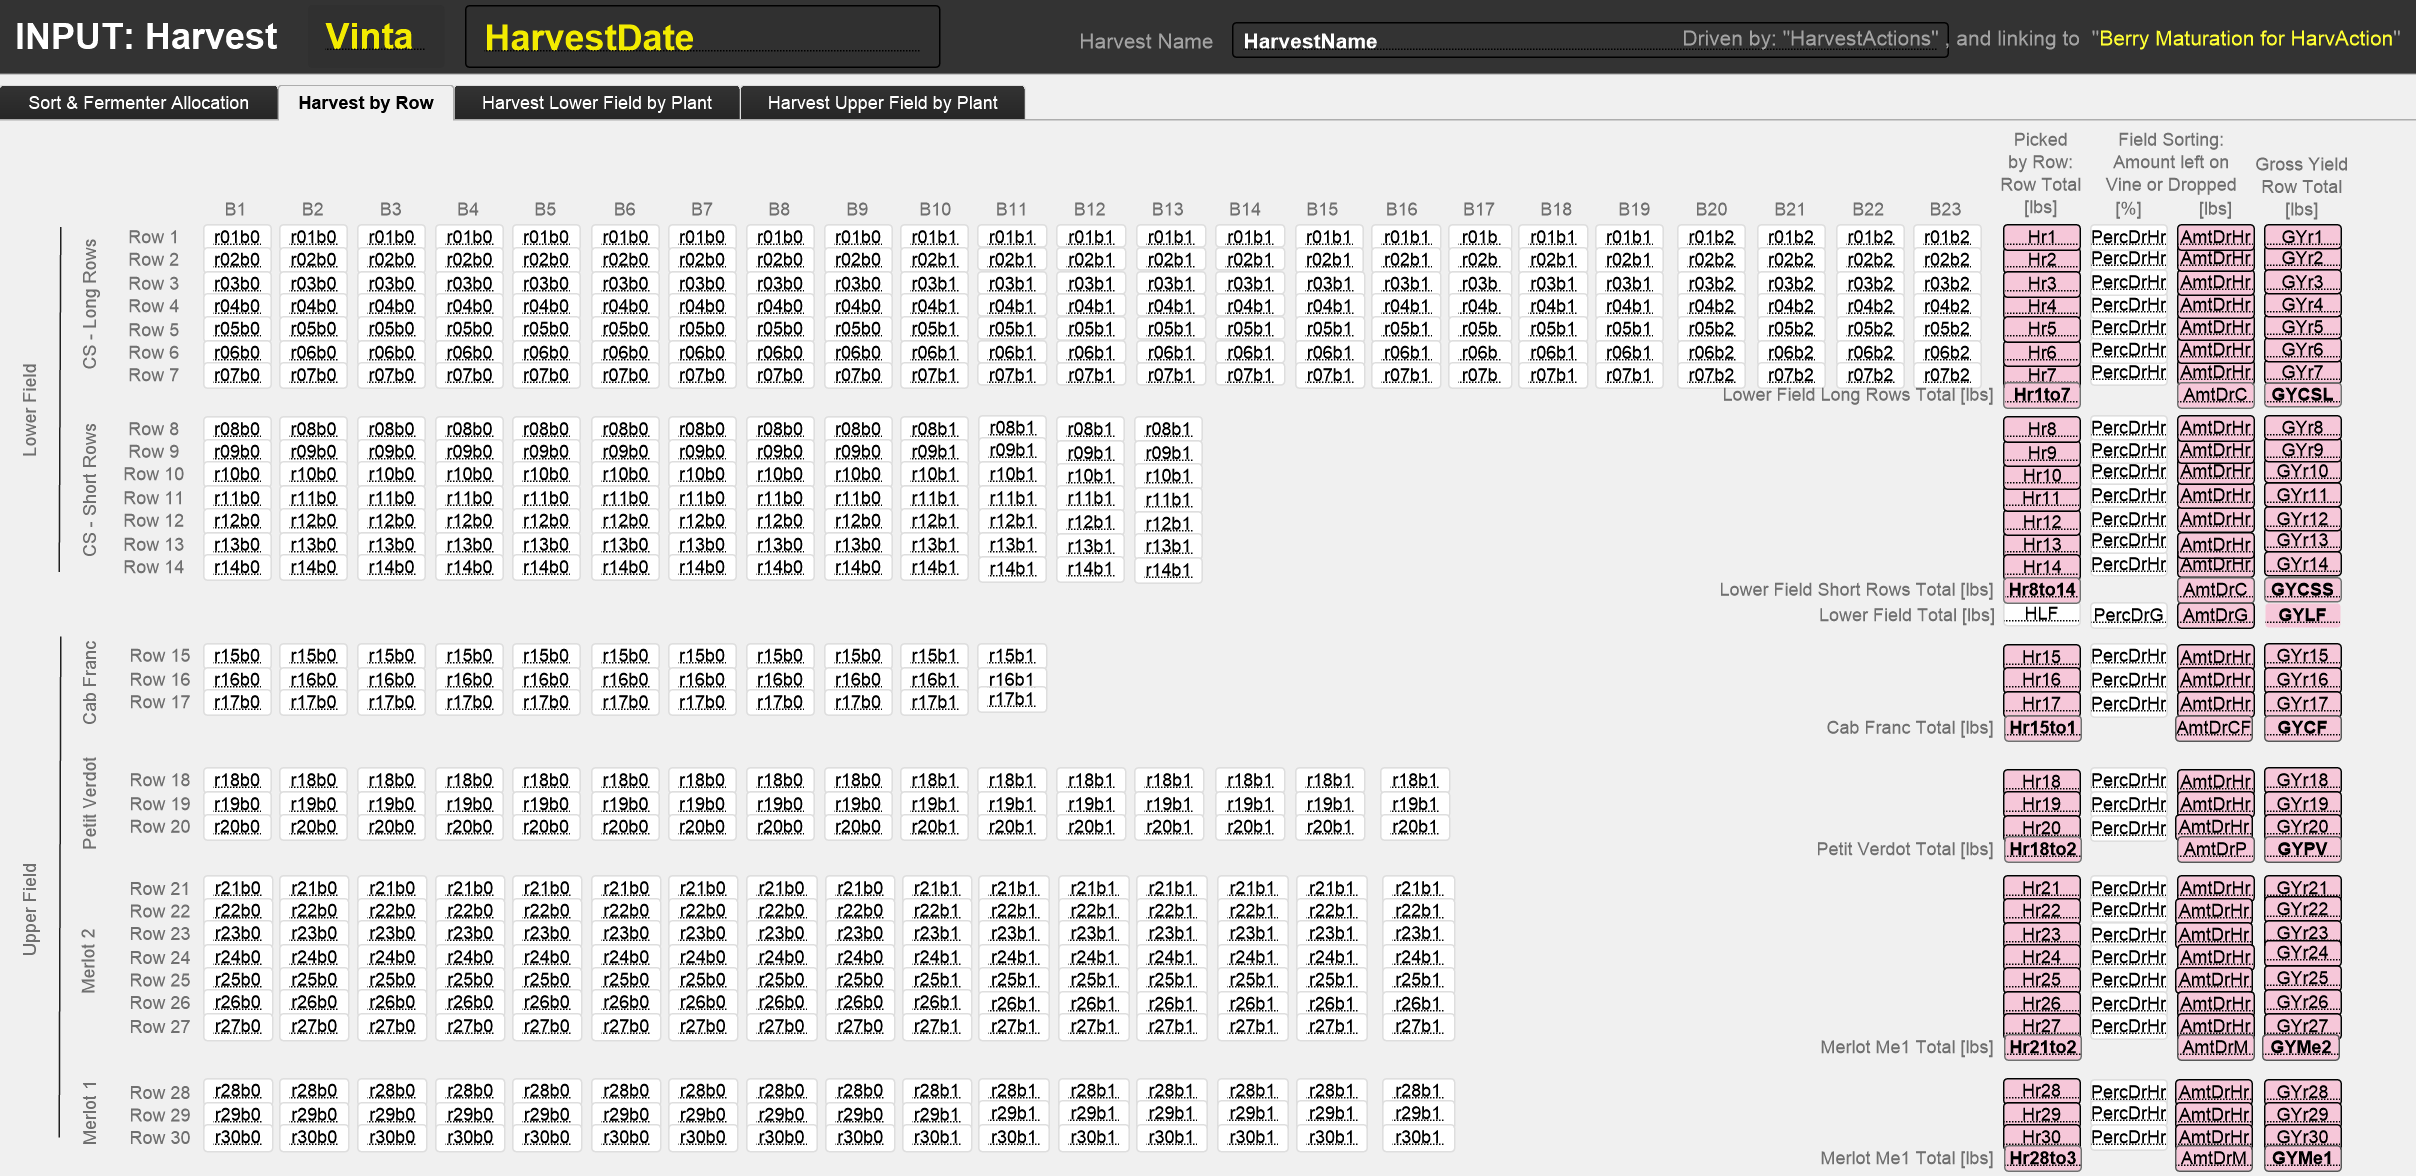
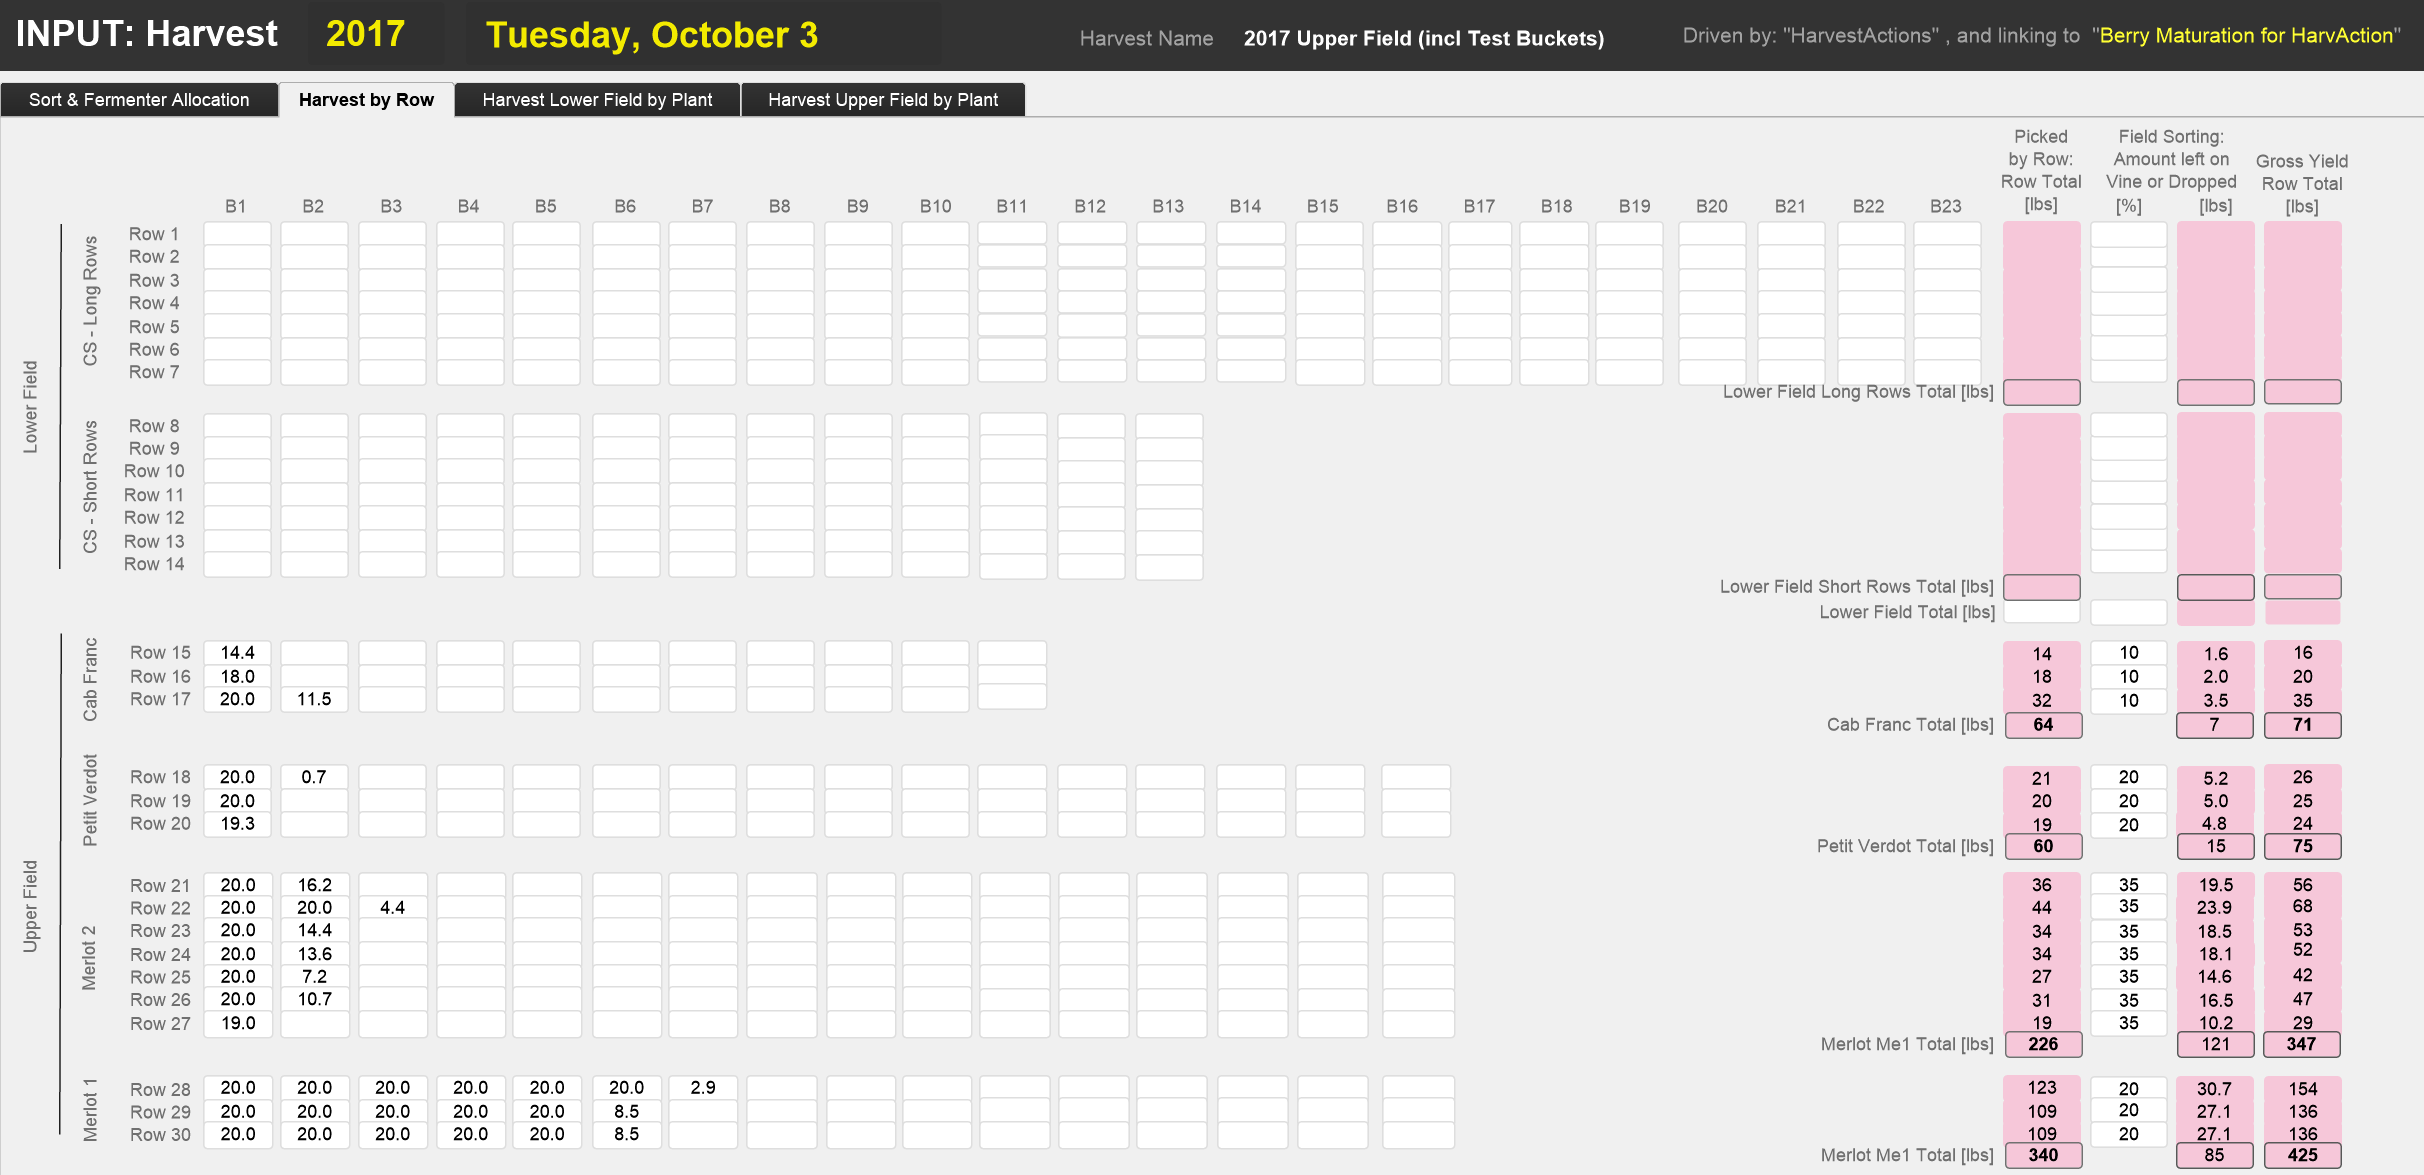
The second tab in this layout is used when we record harvest yields by row. In this case, we collect the bunches in bins (each holding around 20 lbs) labelled by row. Then we estimate what % of bunches we left in the field due to unacceptable quality. The screenshots show the second tab of the layout with field names and, for example, the picking results in the upper field on October 3, 2017
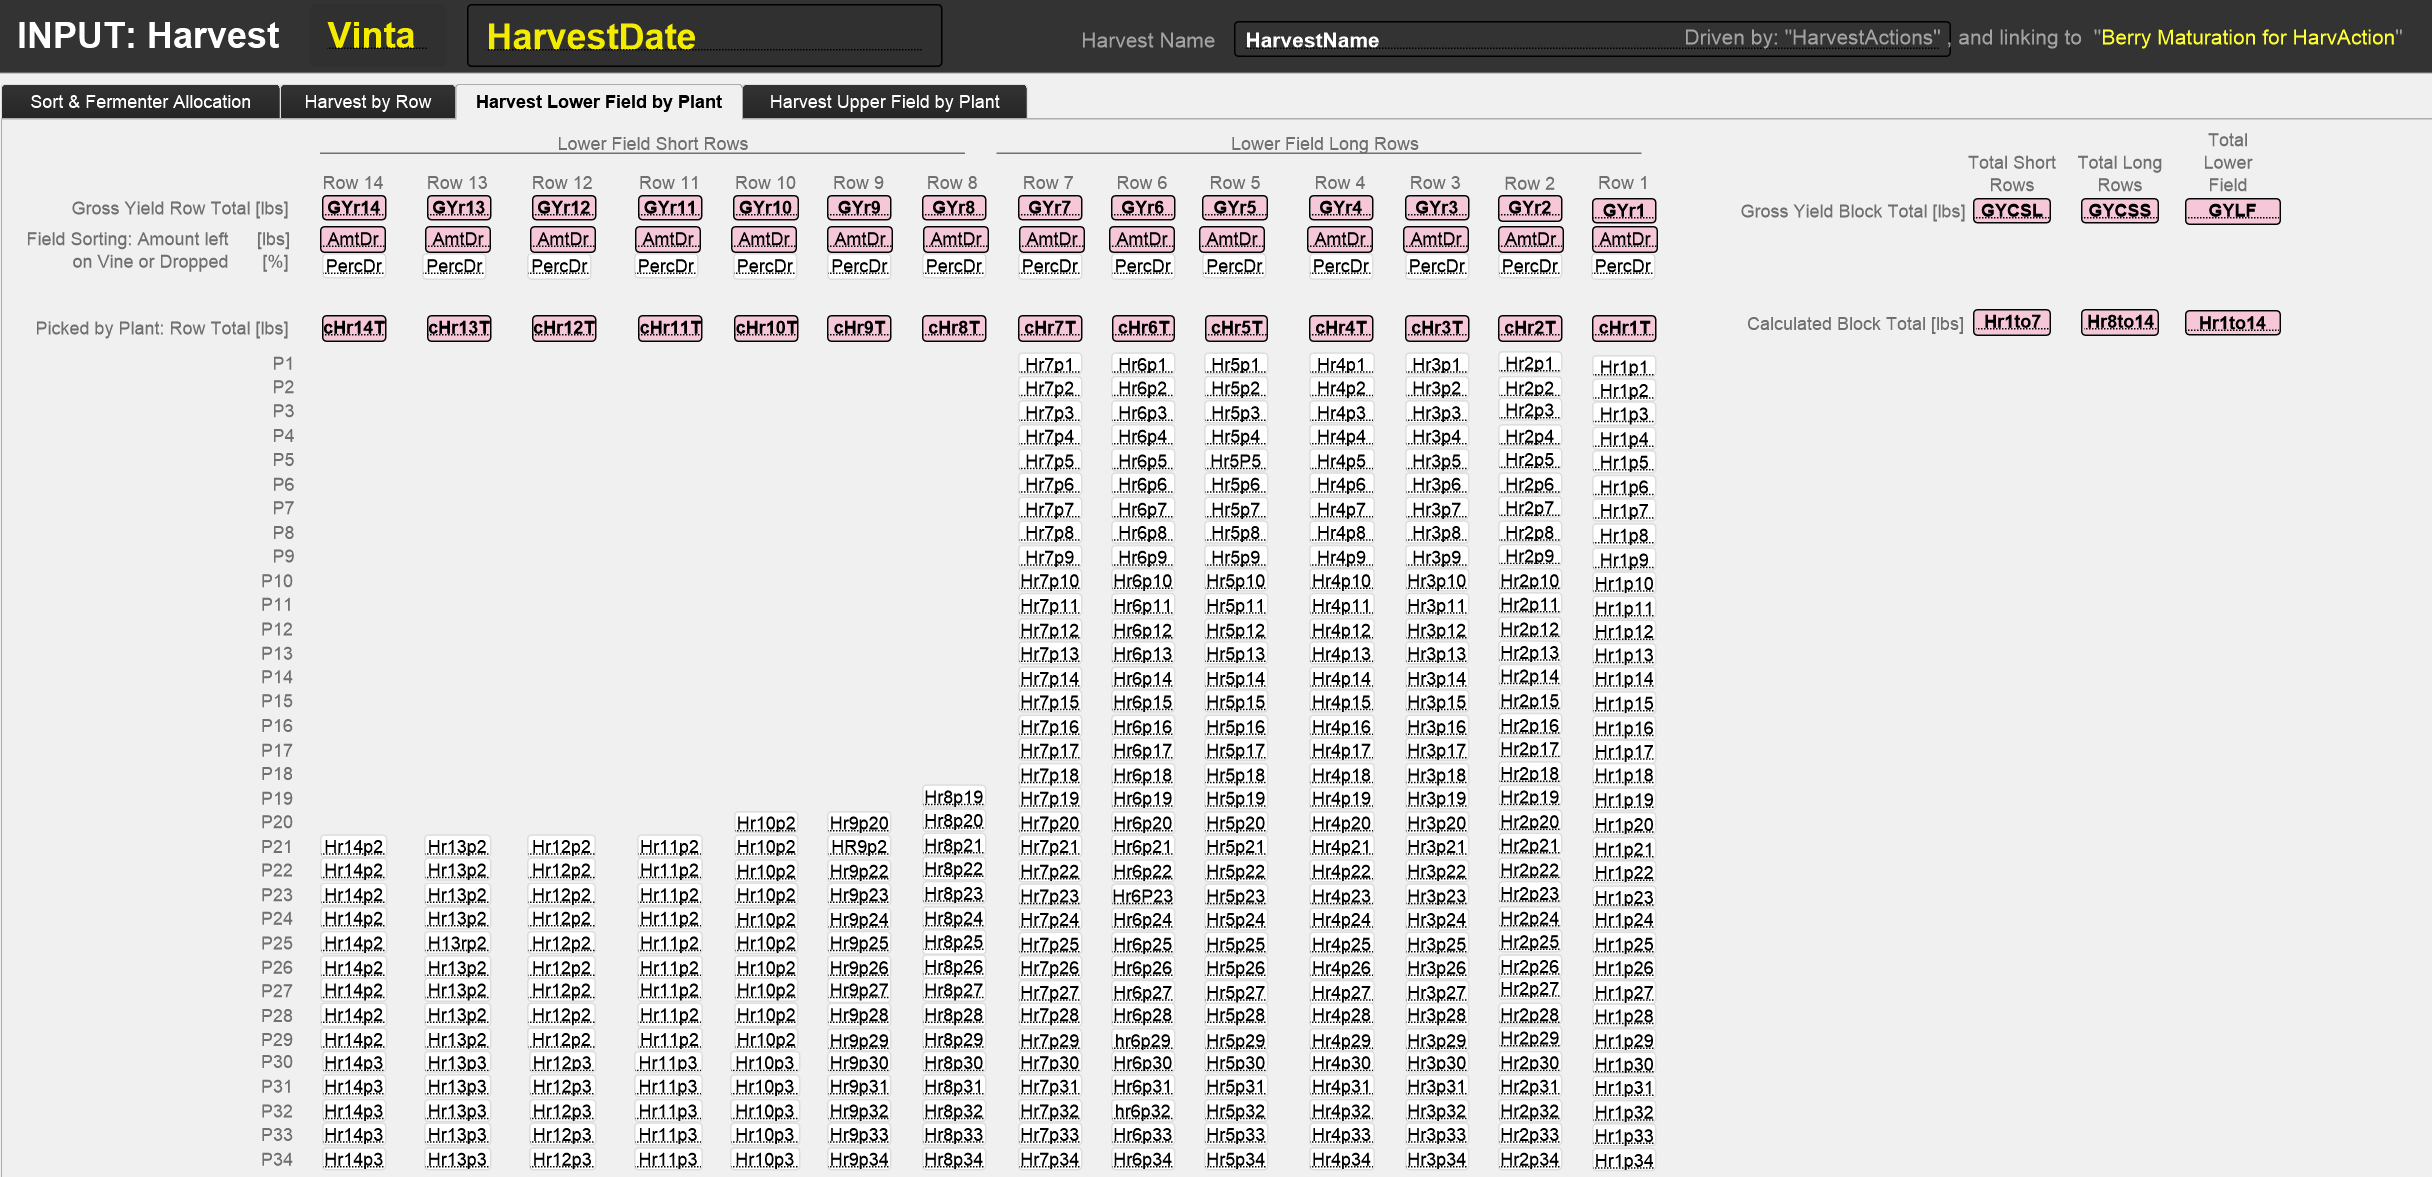
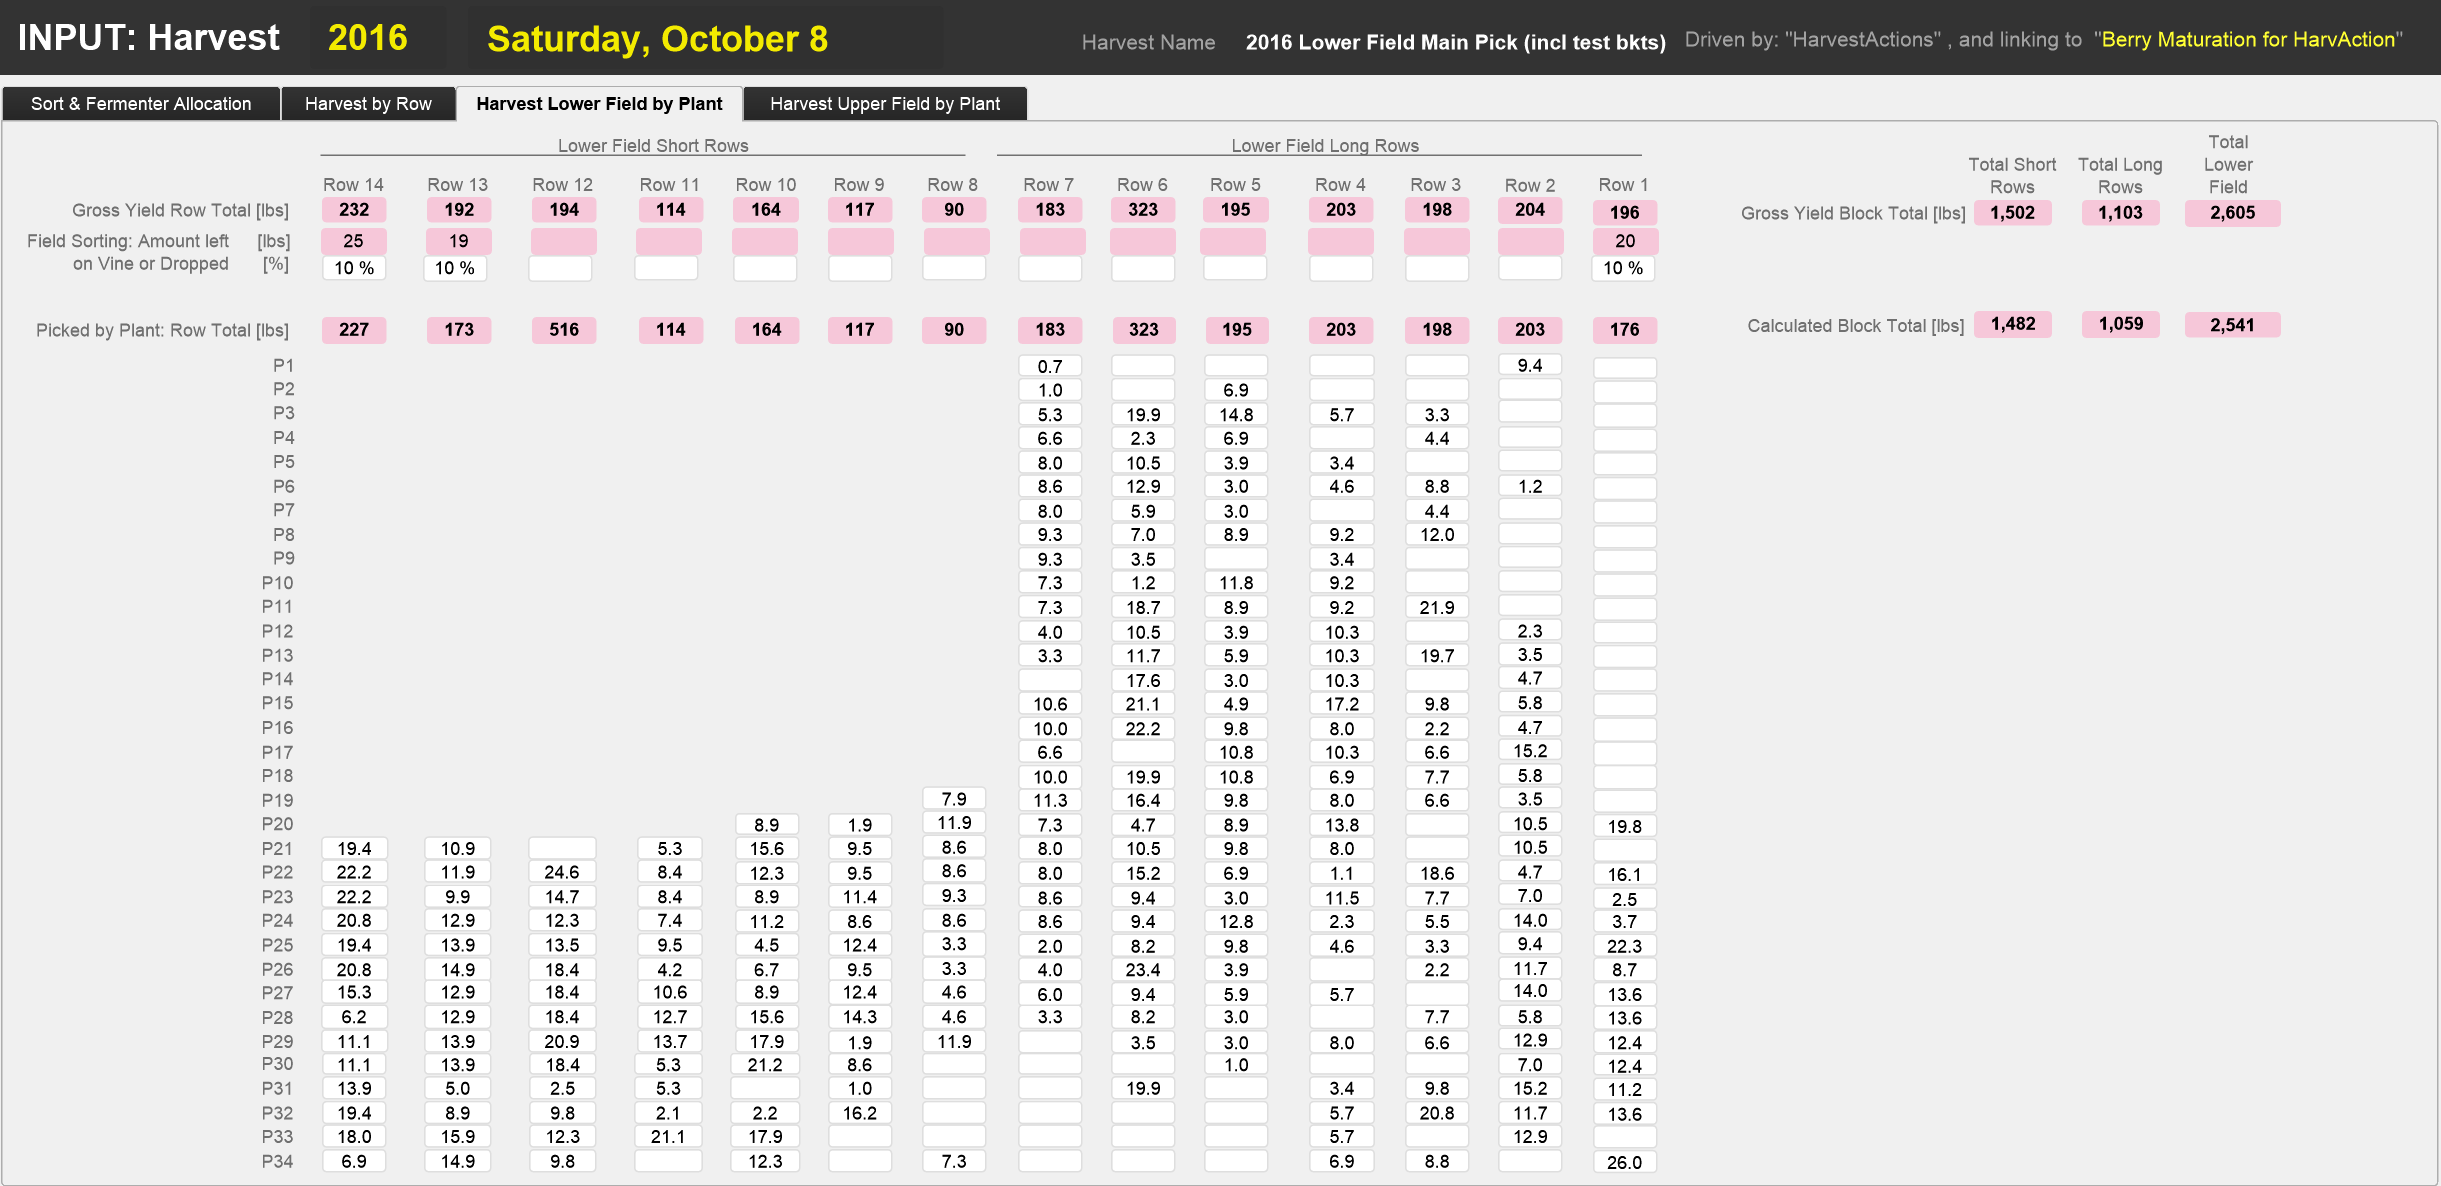
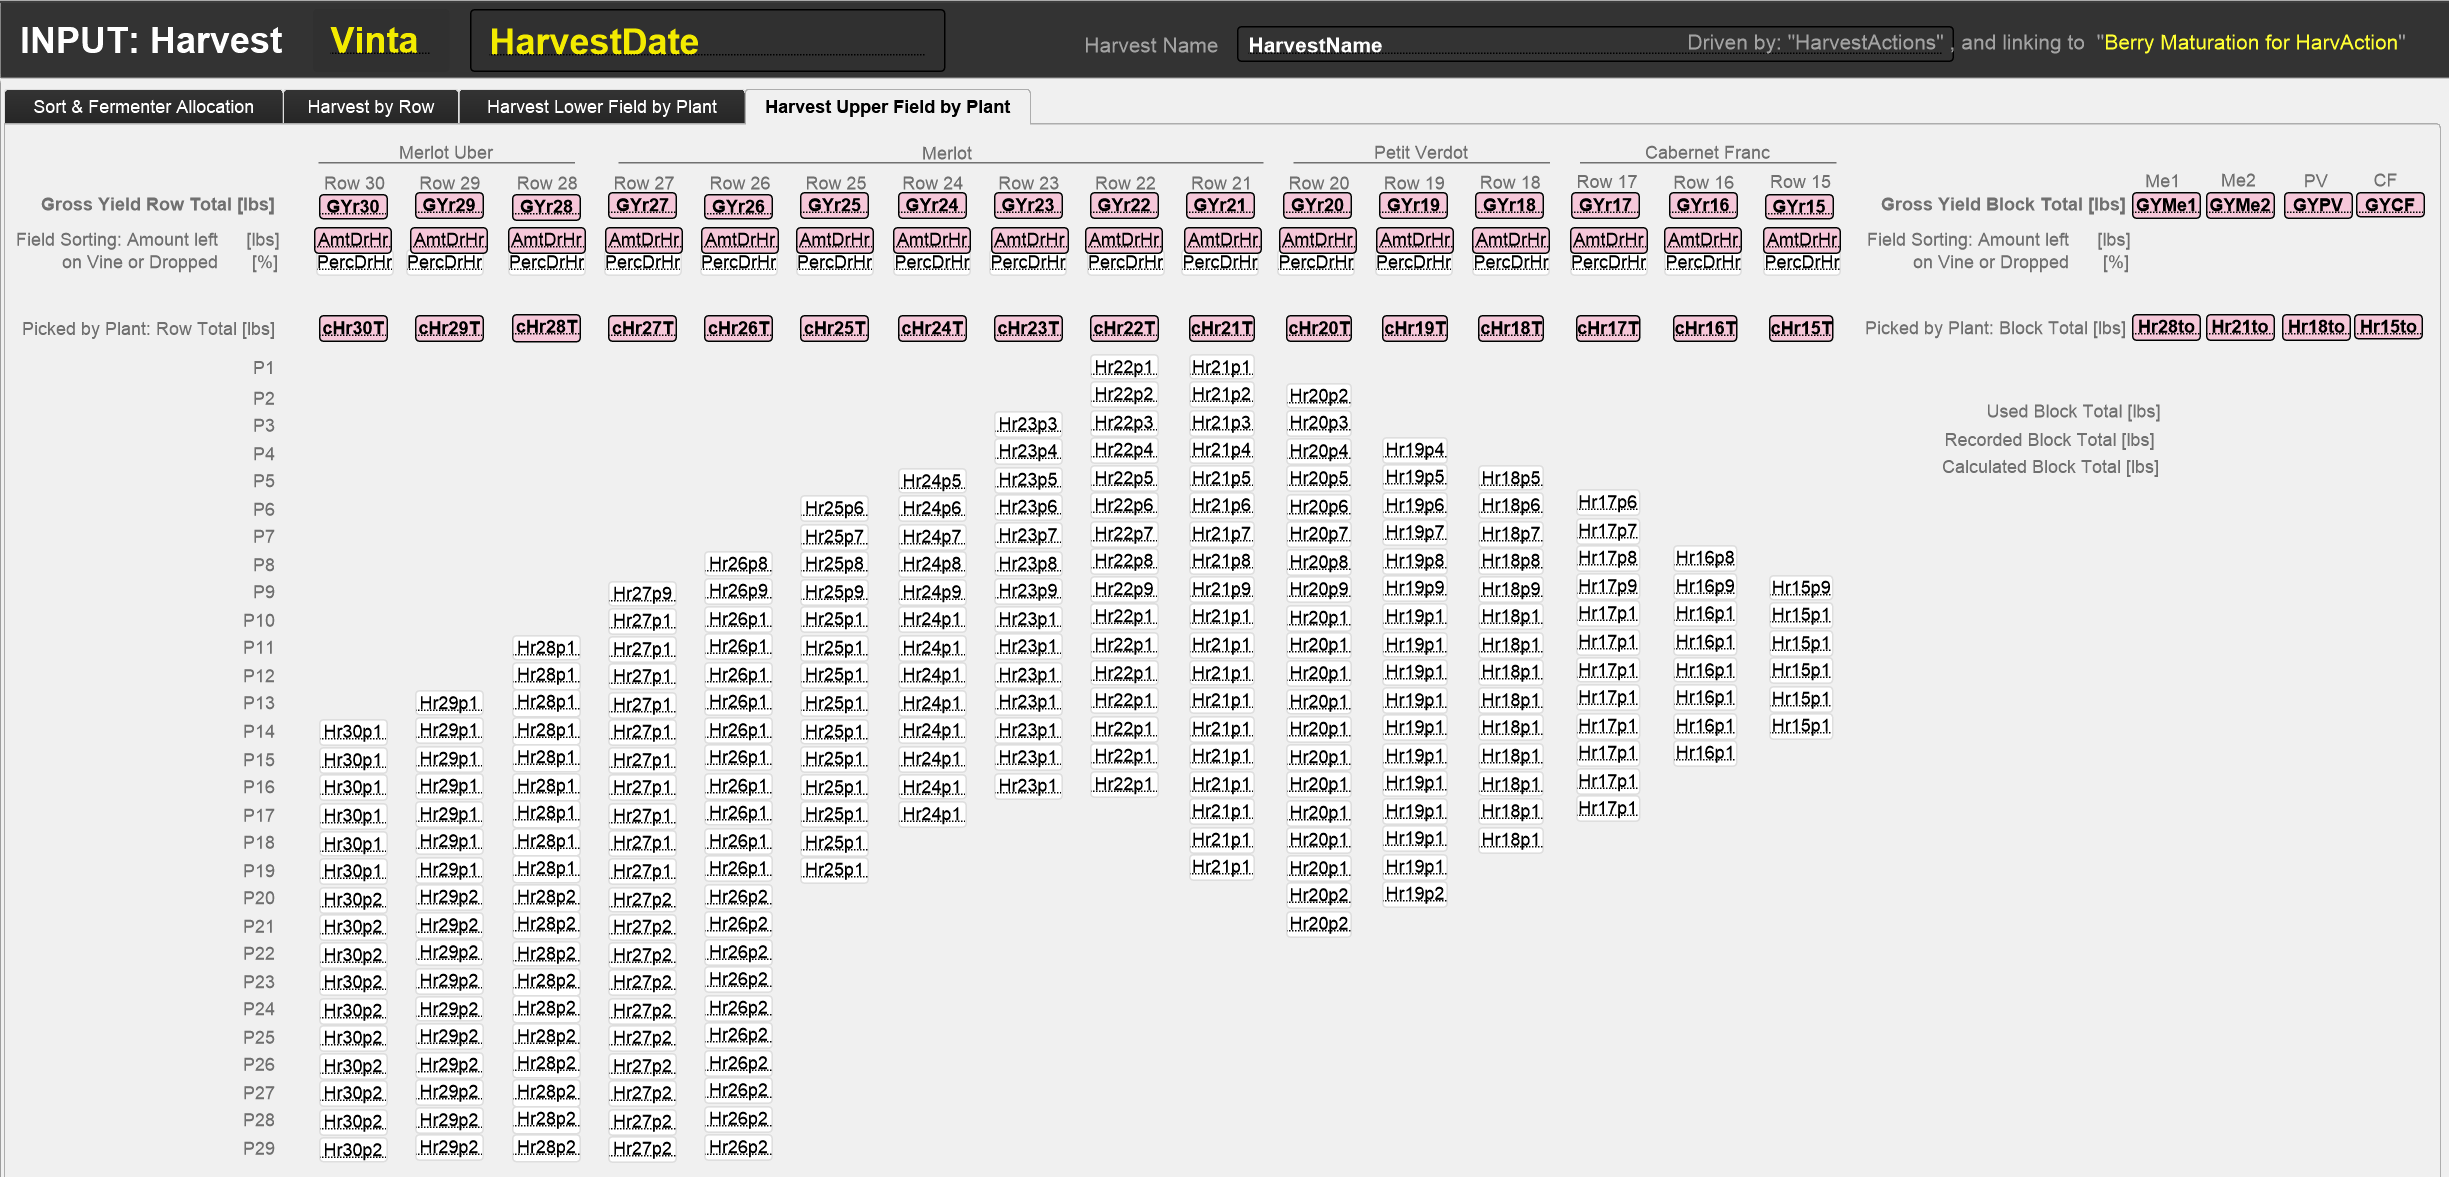
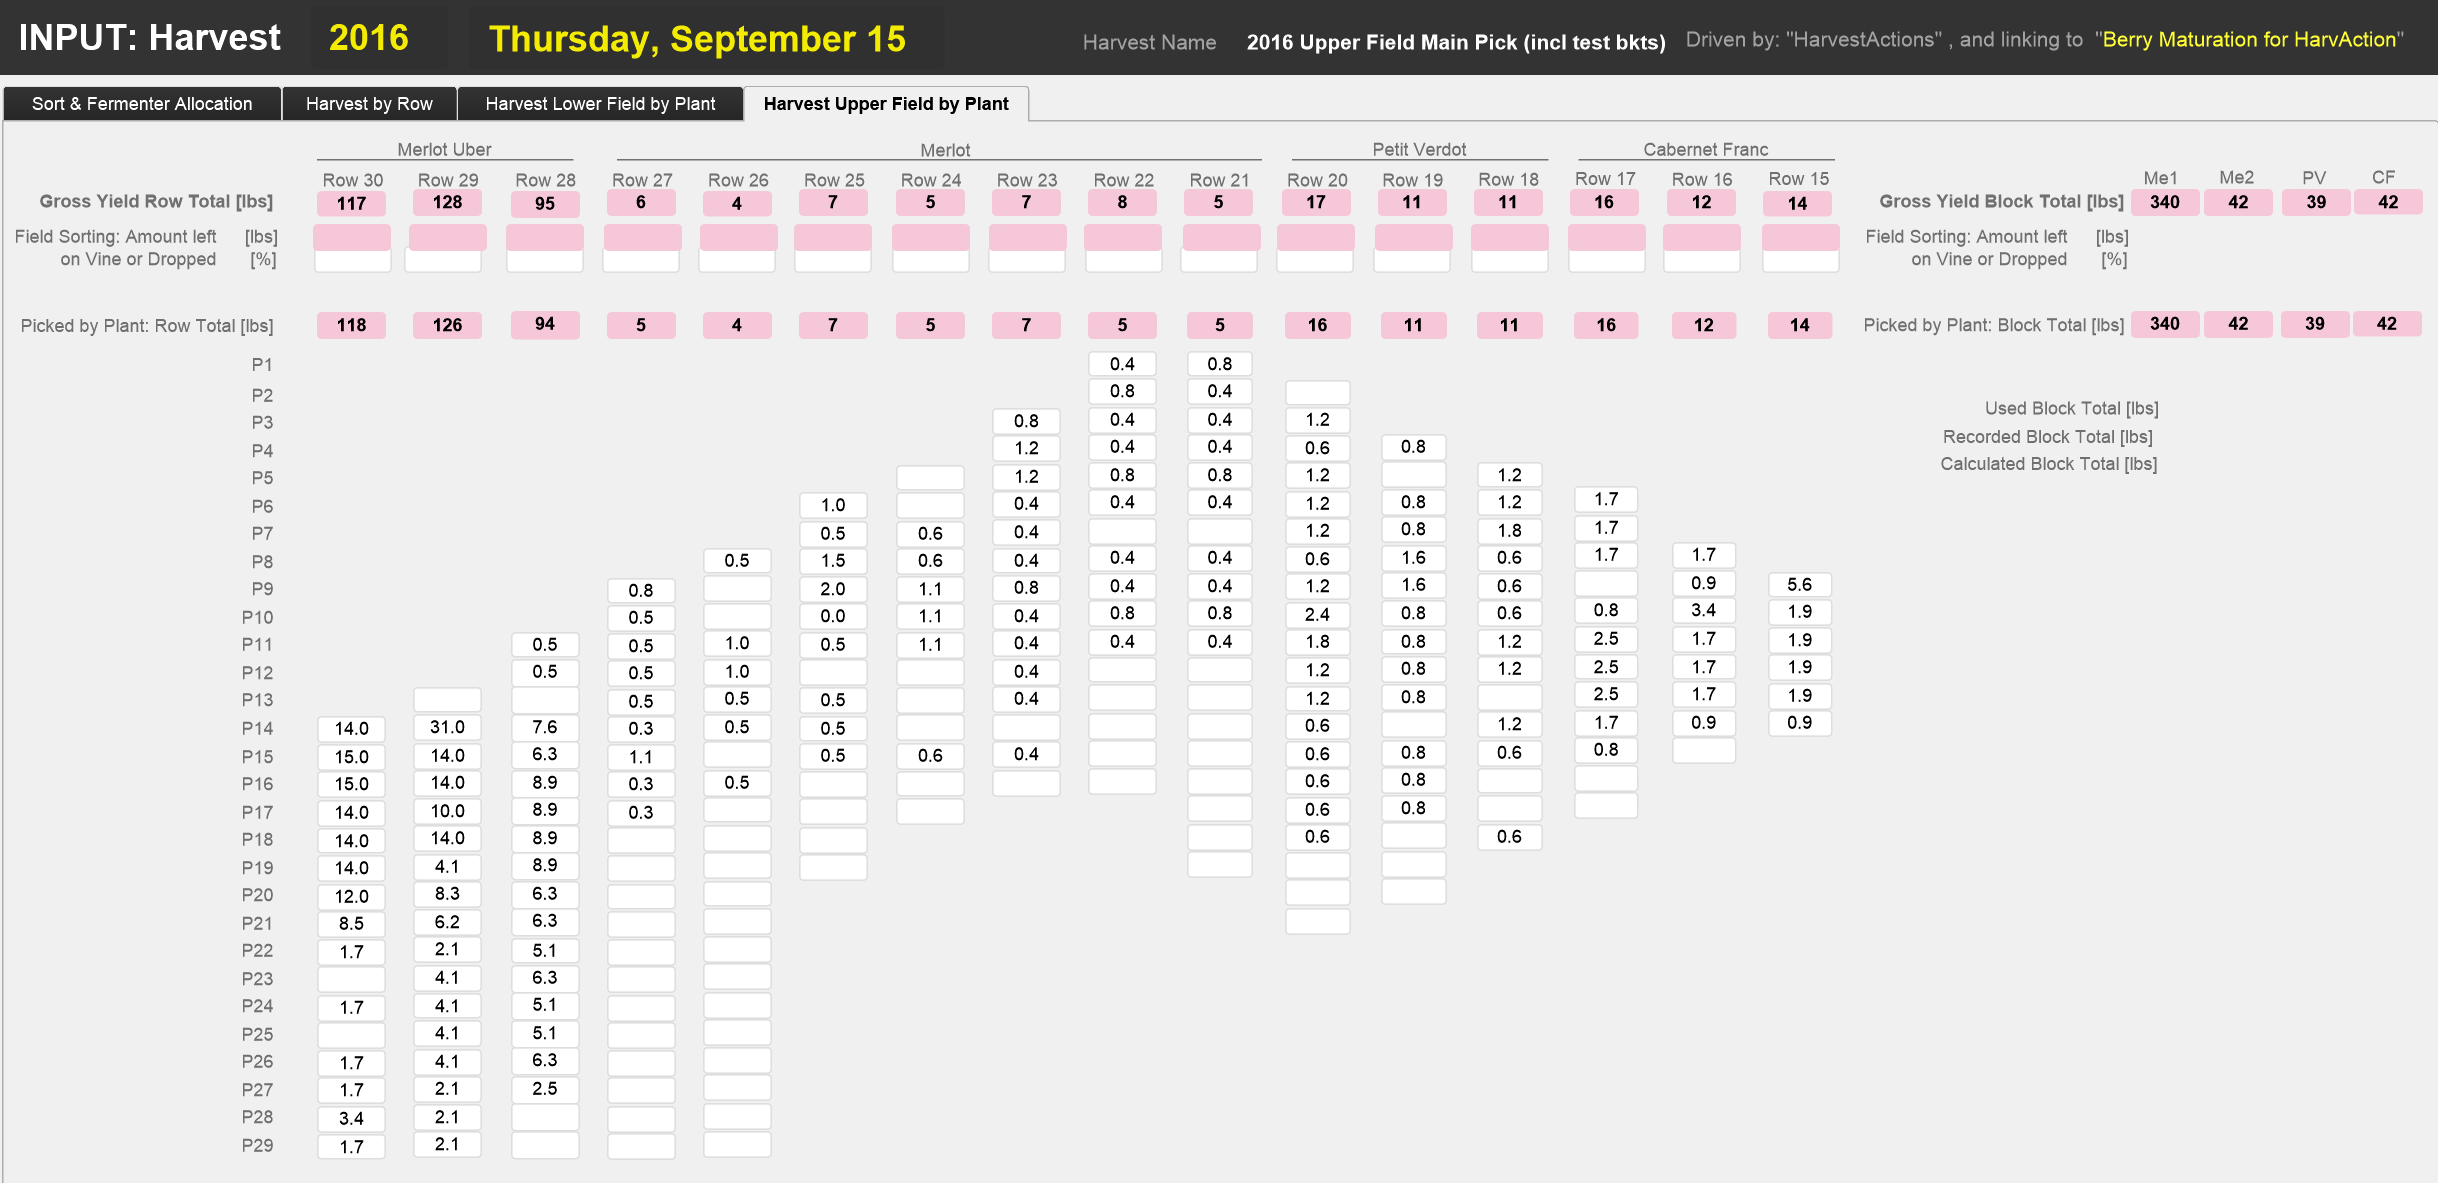
The third and the fourth table are used in the years we decide to record the yield per plant. In these years we have buckets labelled with the identifier of each vine. The screenshots show the layouts with field names and, for example, the harvest results on September 16, 2016, for the upper field and on October 8, 2016, for the lower field
INPUT: Fermentation Actions by Harvest
During fermentations, we punch down 2-3 times a day and take measurements at least once a day. We record all actions and measurements in the FermentationActions for each of the FermentationBatches running in parallel (up to 8). The FermentationBatches for each harvest were defined in the HarvestActions table. Thus the HarvestActions table drives this layout, linking to FermBatchAction records of the respective fermentation batches which in turn link to their respective records in the FermBatchDefinitions table. This graph shows the relationships between the HarvestActions, FermBatchDefinitions and FermActions tables.

Before the data can be recorded in this layout, the respective records in FermBatchAction table have to be created (see CREATE: FermBatchAction). Because of the large amount of data, the layout has 5 tabs
- The Actions tab describes what actions have been taken
- The Juice Analysis tab holds the results from the chemical measurements with OenoFoss and the spectral for and phenolic results from WineXray.
- The MUF Calibration tab shows how we calibrate the chemical measurements for Must-Under-Fermentation with the Foss-calibrated chemical measurements for Must and Finished-Wine.
- The remaining tabs show, graphically, how the current measurements compare to past recordings for the same fermentation batch.
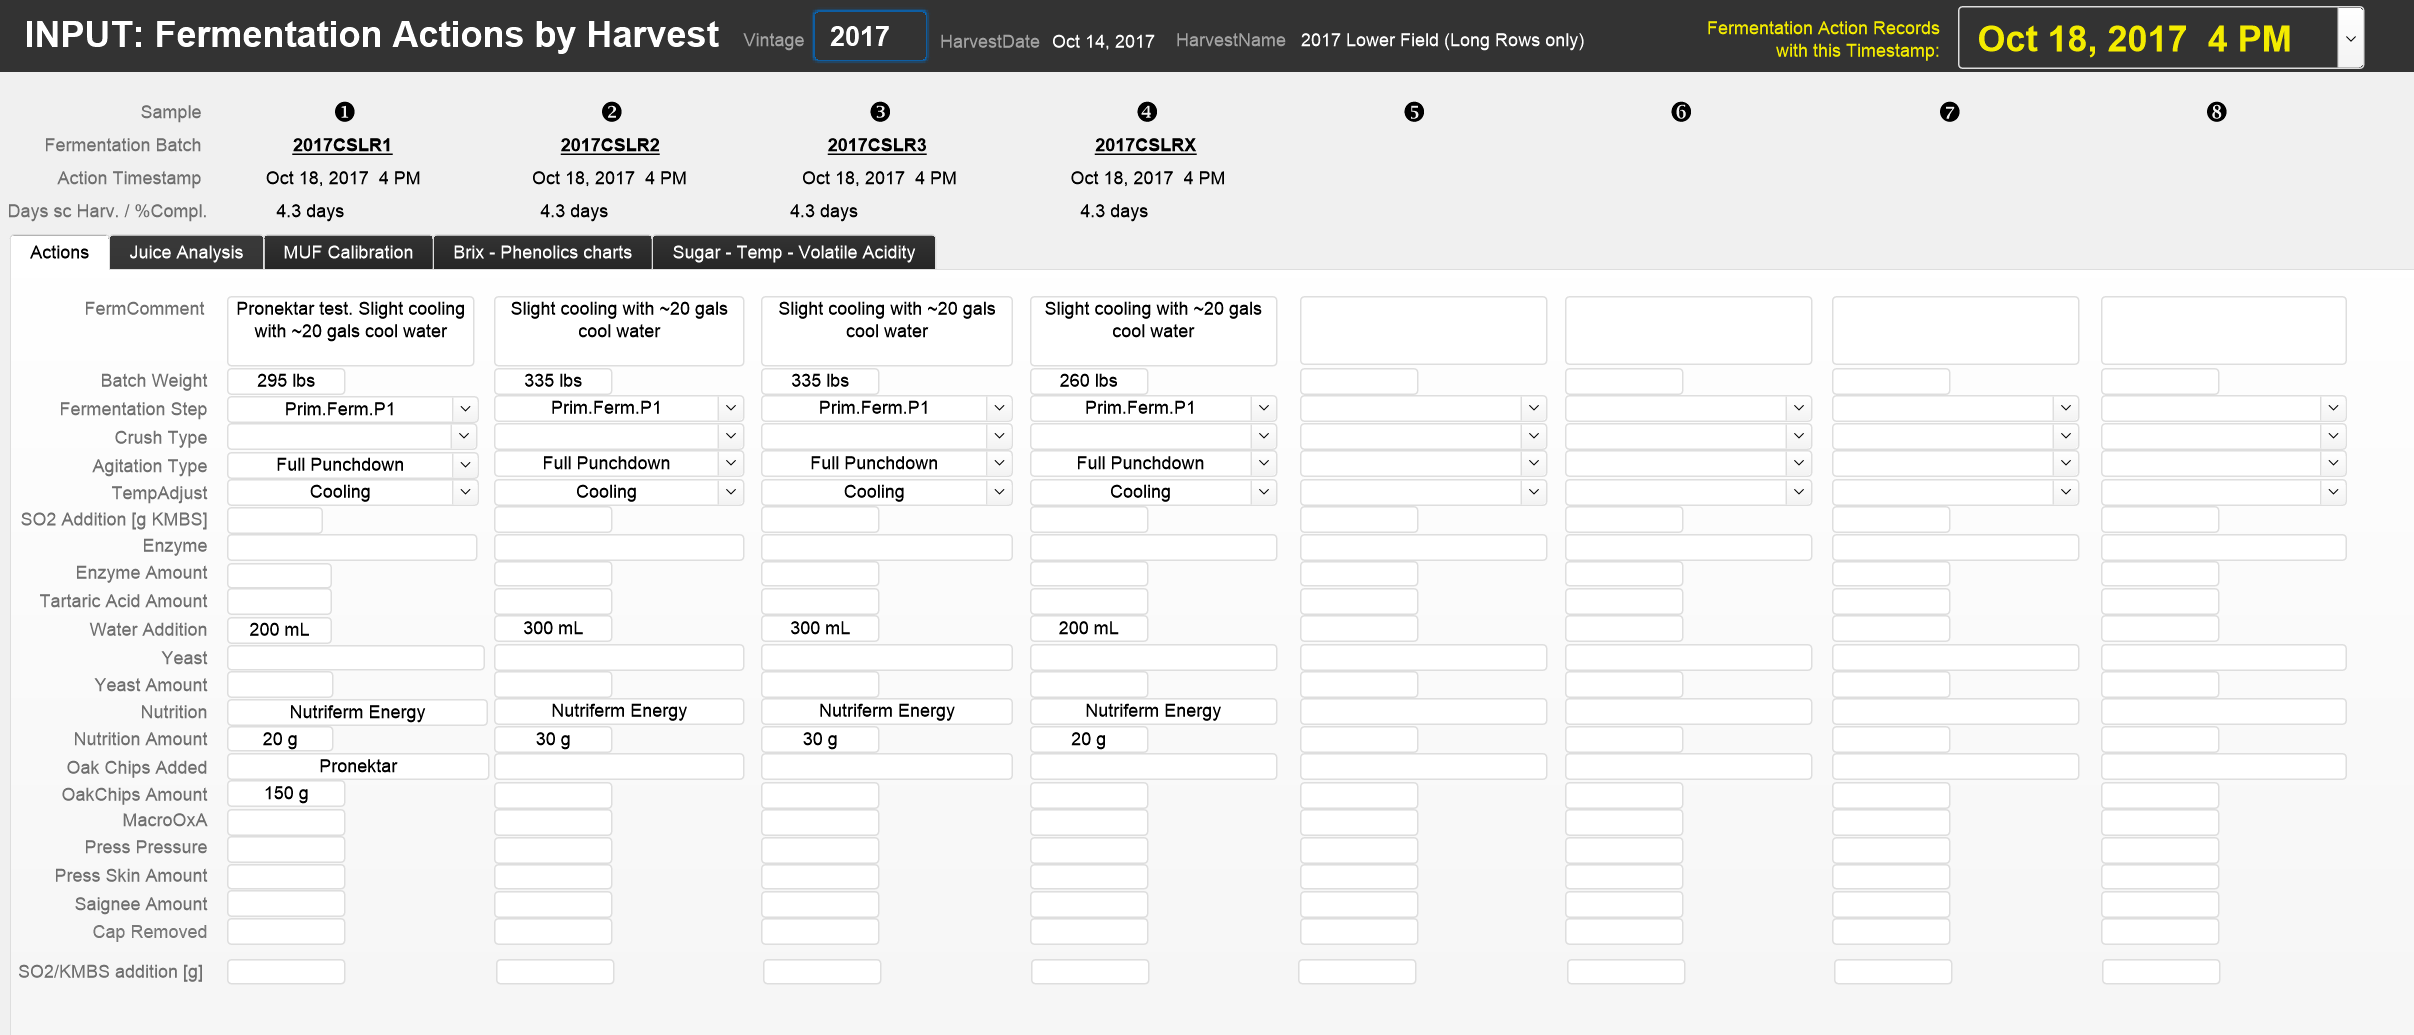
The Actions -tab covers all types of actions that can be taken during a fermentation. A detailed description of each field will be added to the website later. These screenshots show the layout in the Action-tab with field names and, for example, the record for the fermentation actions on October 18 at 4 pm for the October 14, 2017 vintage.

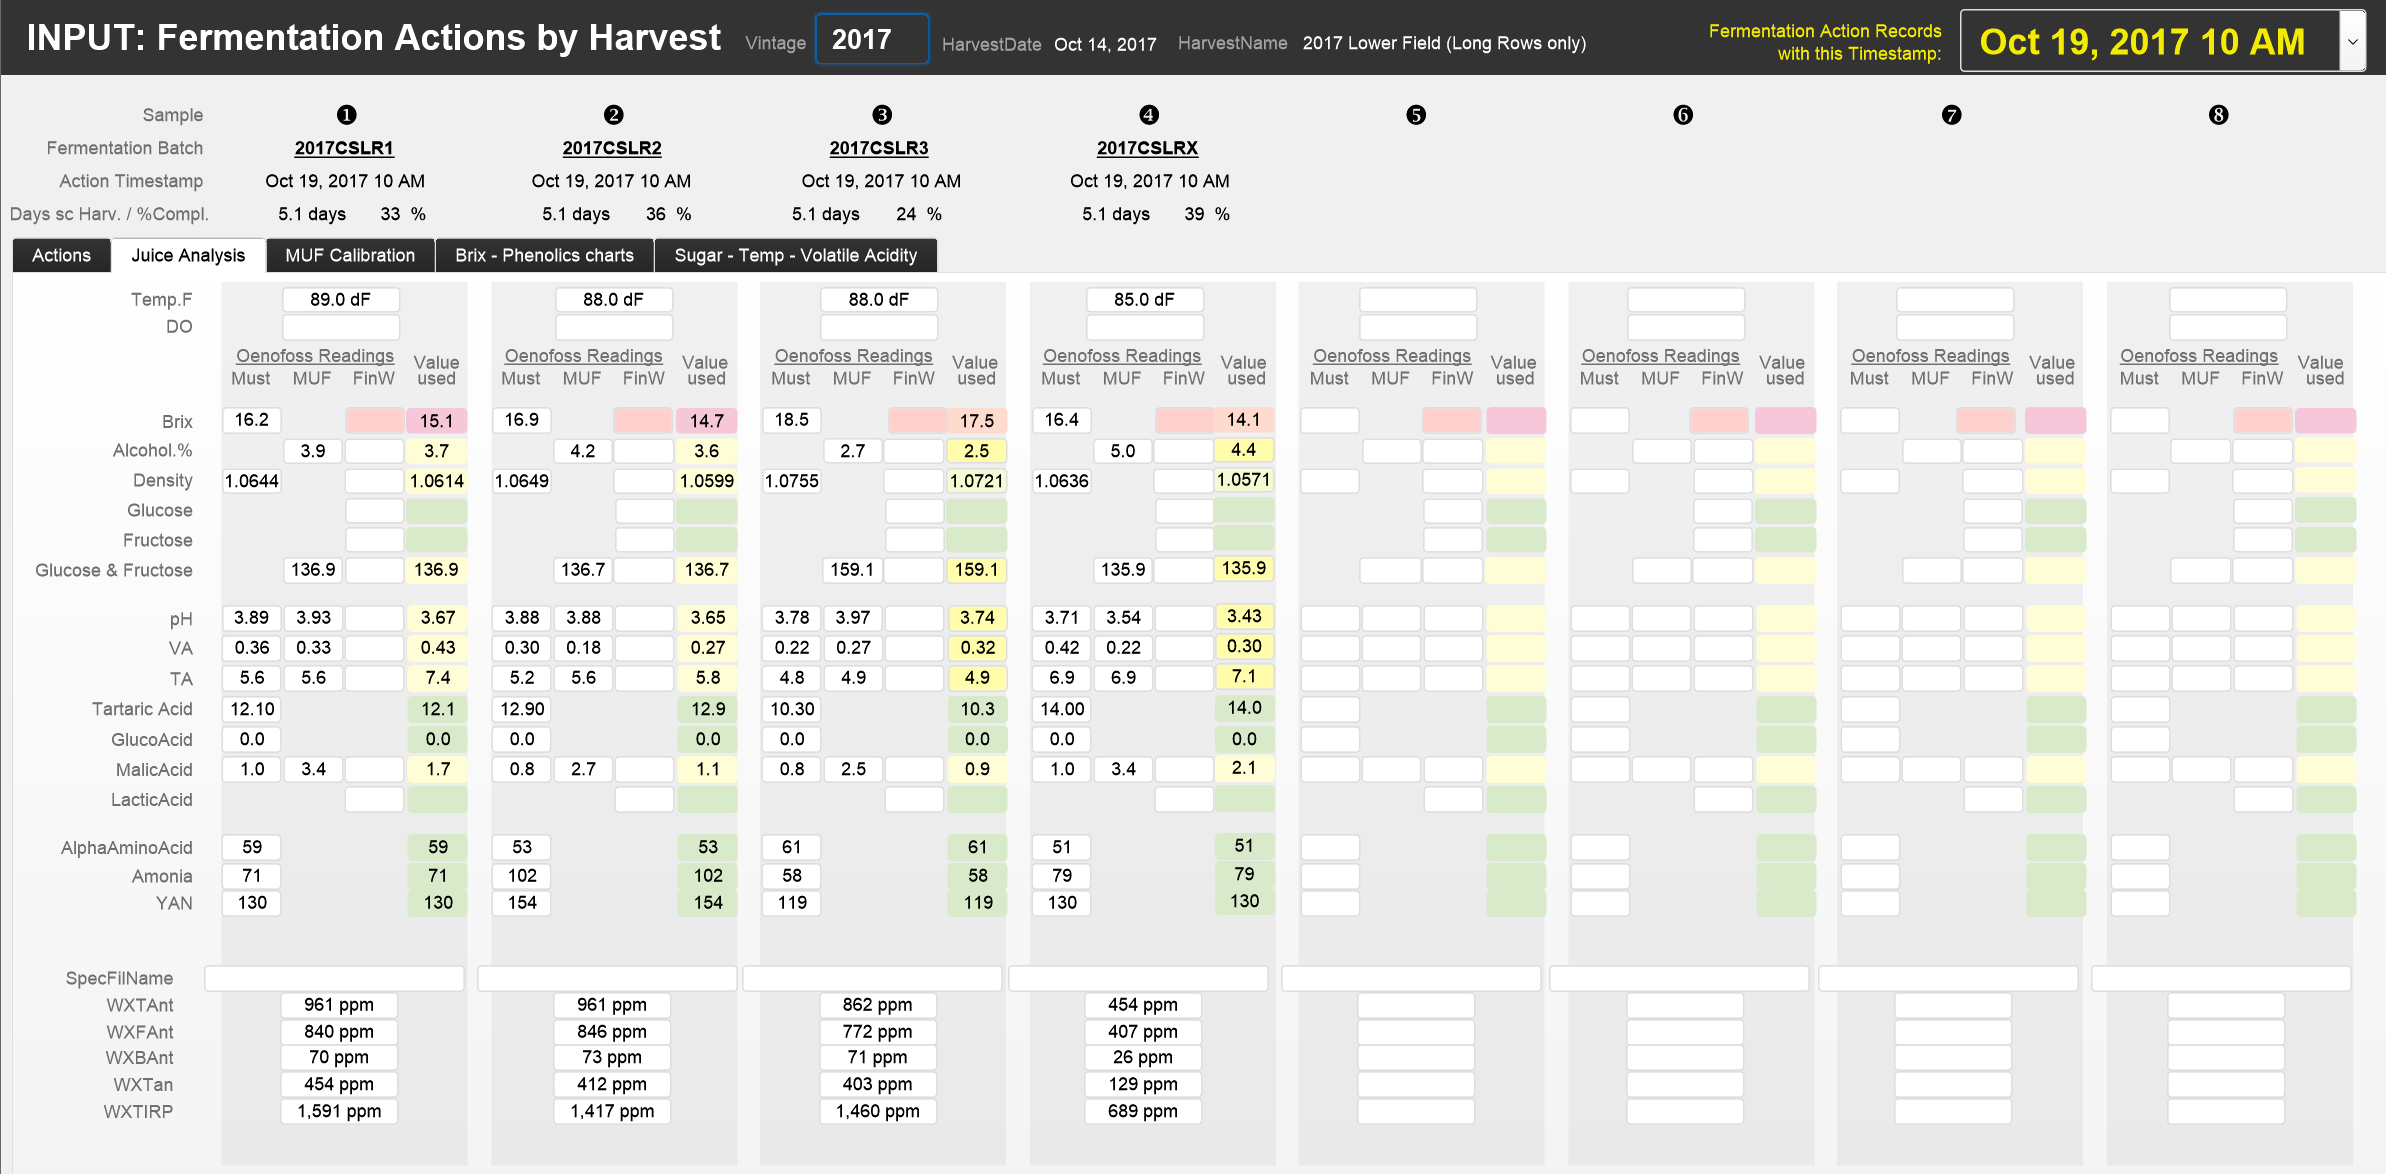
The Juice Analysis - tab in the layout is designed to input the result from the analyses of the juice samples from the different fermentation tanks. We have the facility to record temperature, dissolved oxygen, the full set of OenoFoss results for Must, Must-under-Fermentation and Finished-Wine and the results from the WineXRay phenolics analysis.
A detailed description of the fields will be provided in an upcoming revision of the Laboratory-segment of the website.
These screenshots show the field names in the second tab and, for example, the recording of the chemical tests run on the samples taken at 10 am on October 19, 2017, from the fermentation tanks holding the October 14, 2017 vintage:
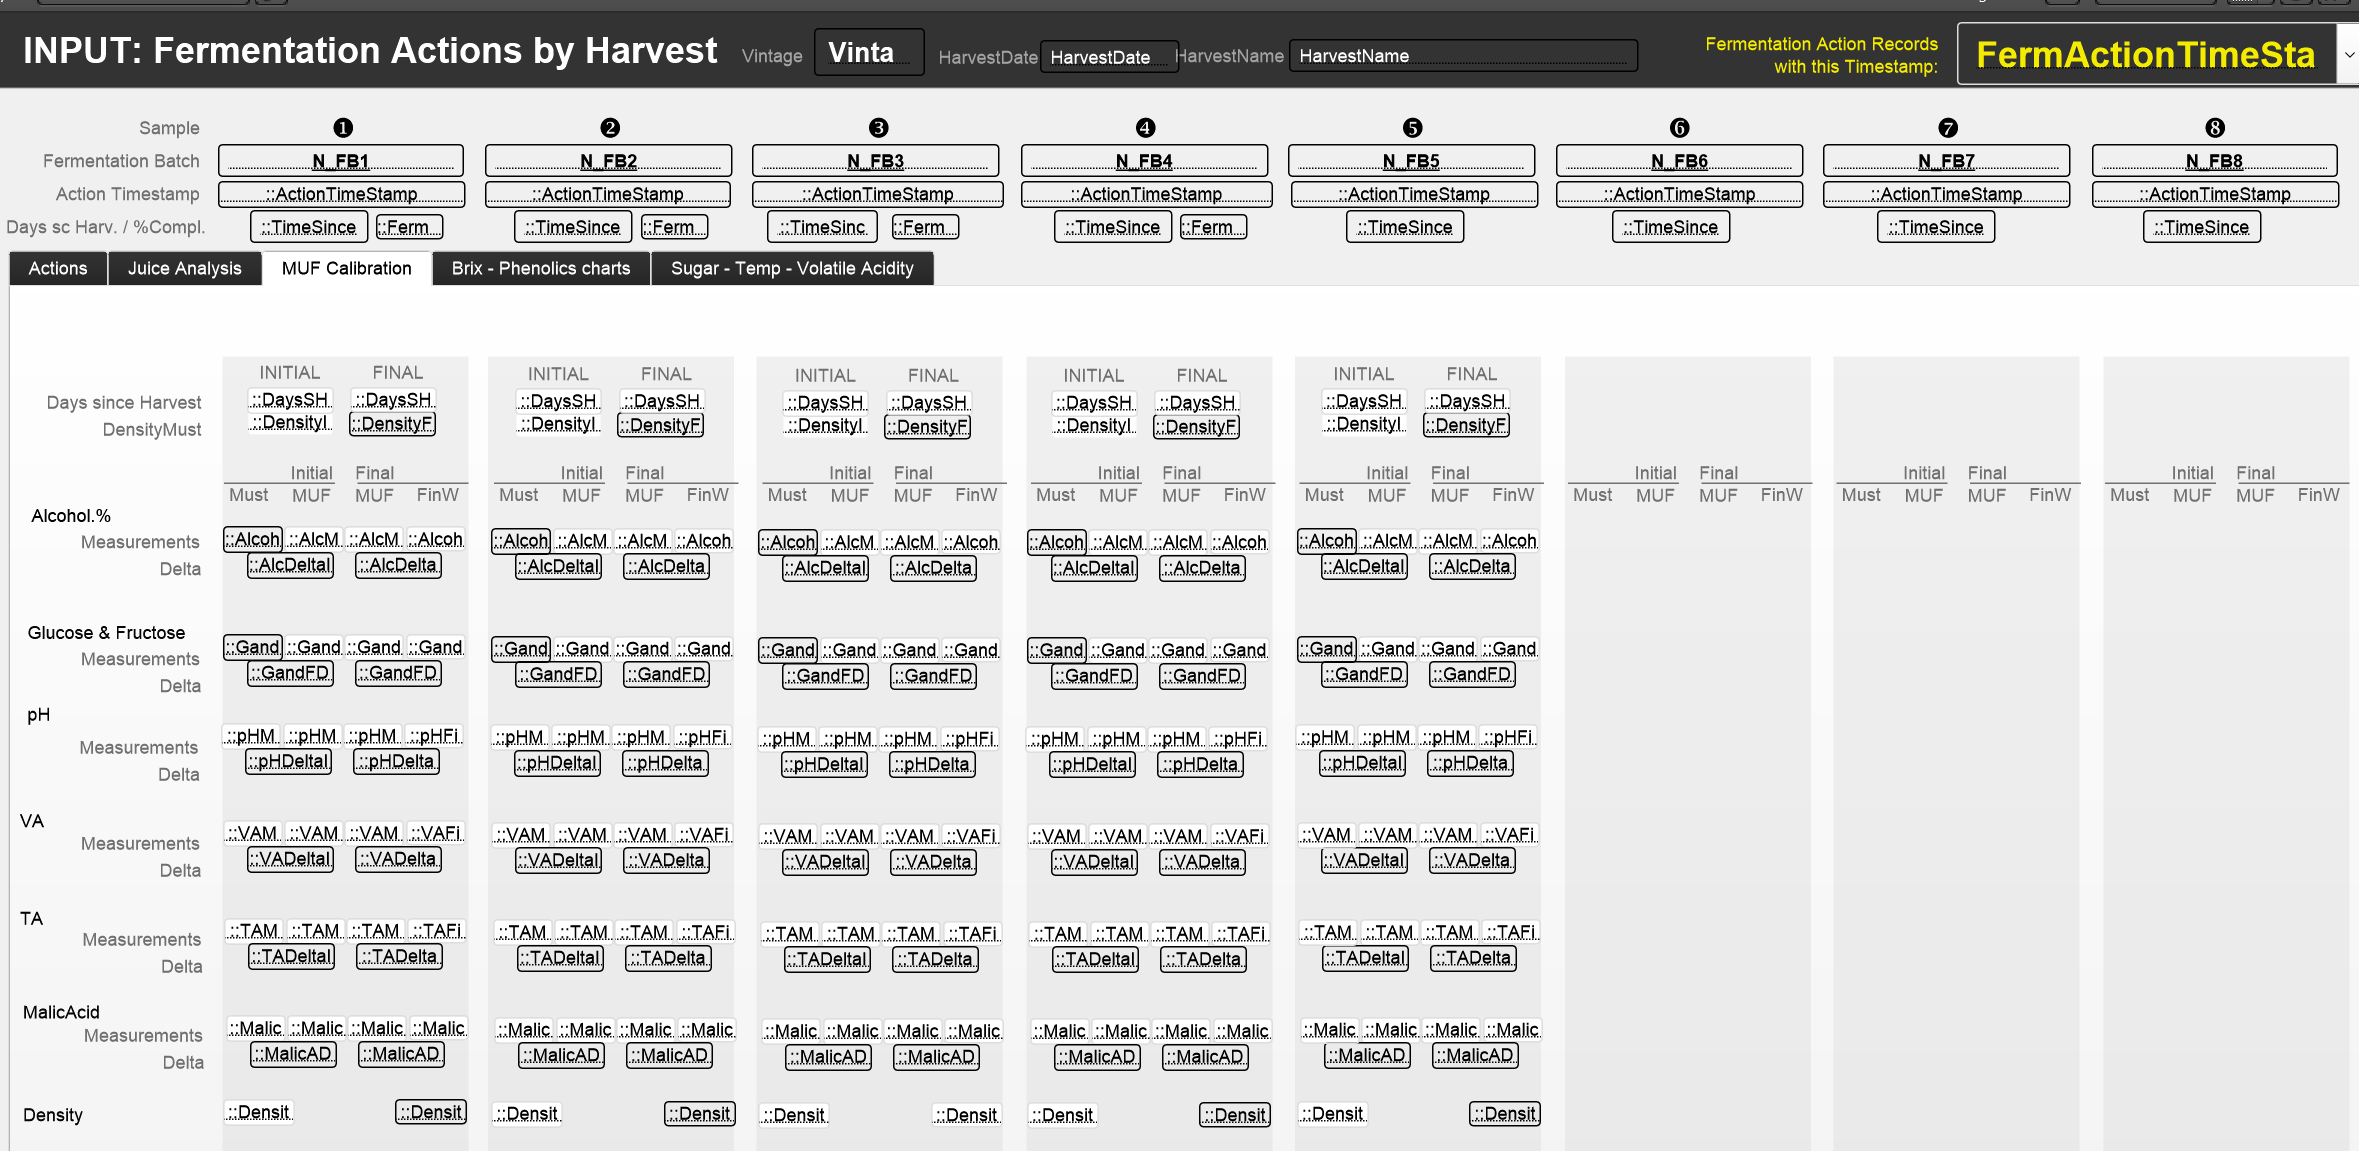
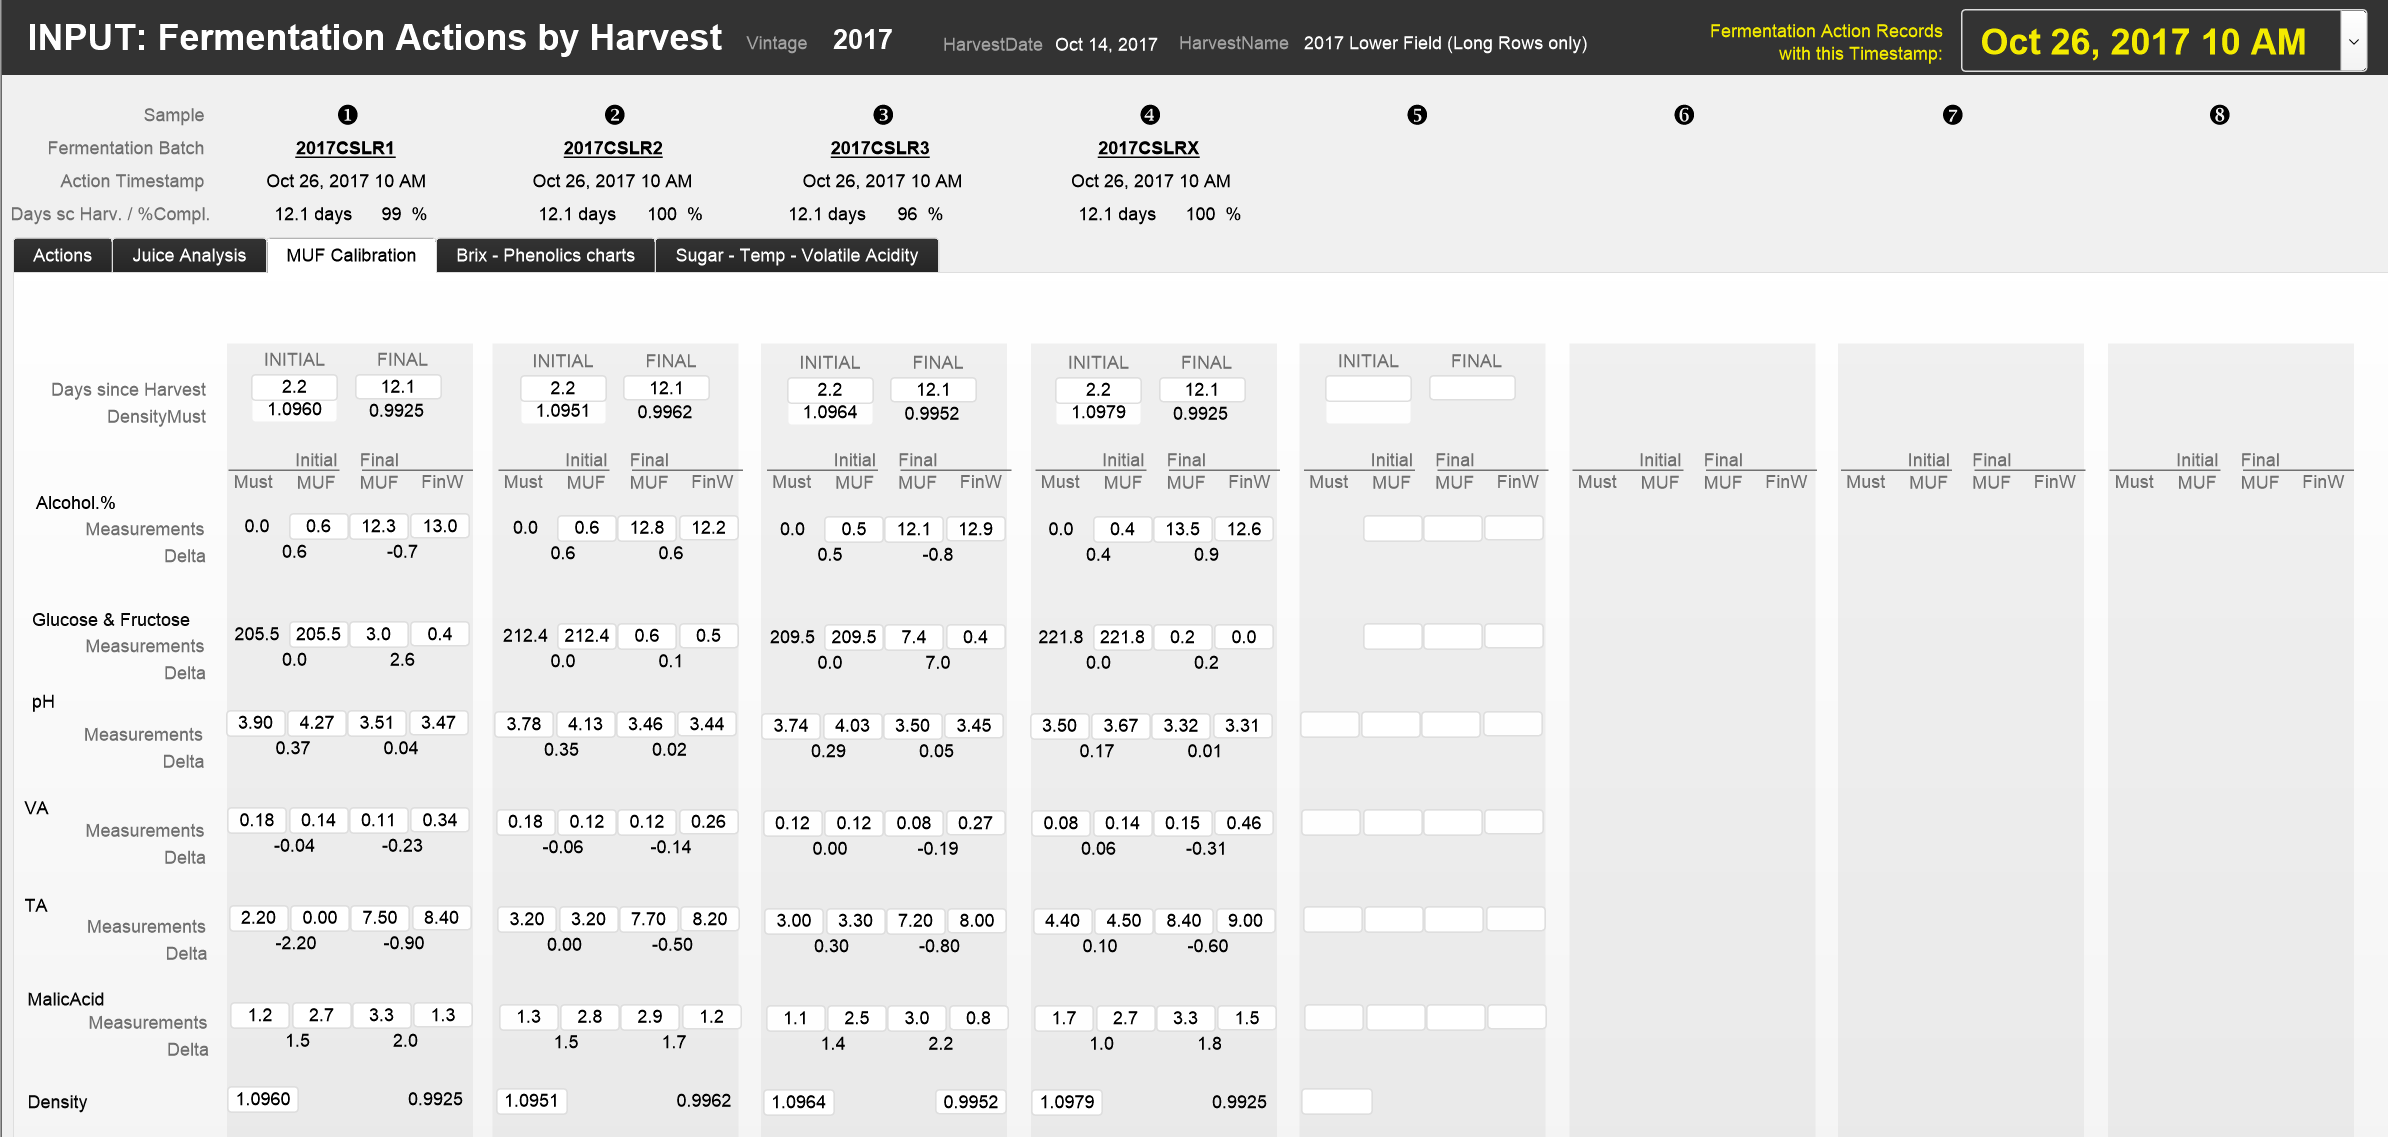
The MUF-Calibration - tab in the layout is designed to illustrate how the OenoFoss measurements during fermentation get adjusted using the boundary conditions (i.e. the measurements before and after the fermentation)
A detailed description of the fields will be provided in an upcoming revision of the Laboratory-segment of the website.
These screenshots show the field names in the second tab and, for example, the recording of the chemical tests run on the samples taken at 10 am on October 26, 2017, from the fermentation tanks holding the October 14, 2017 vintage:

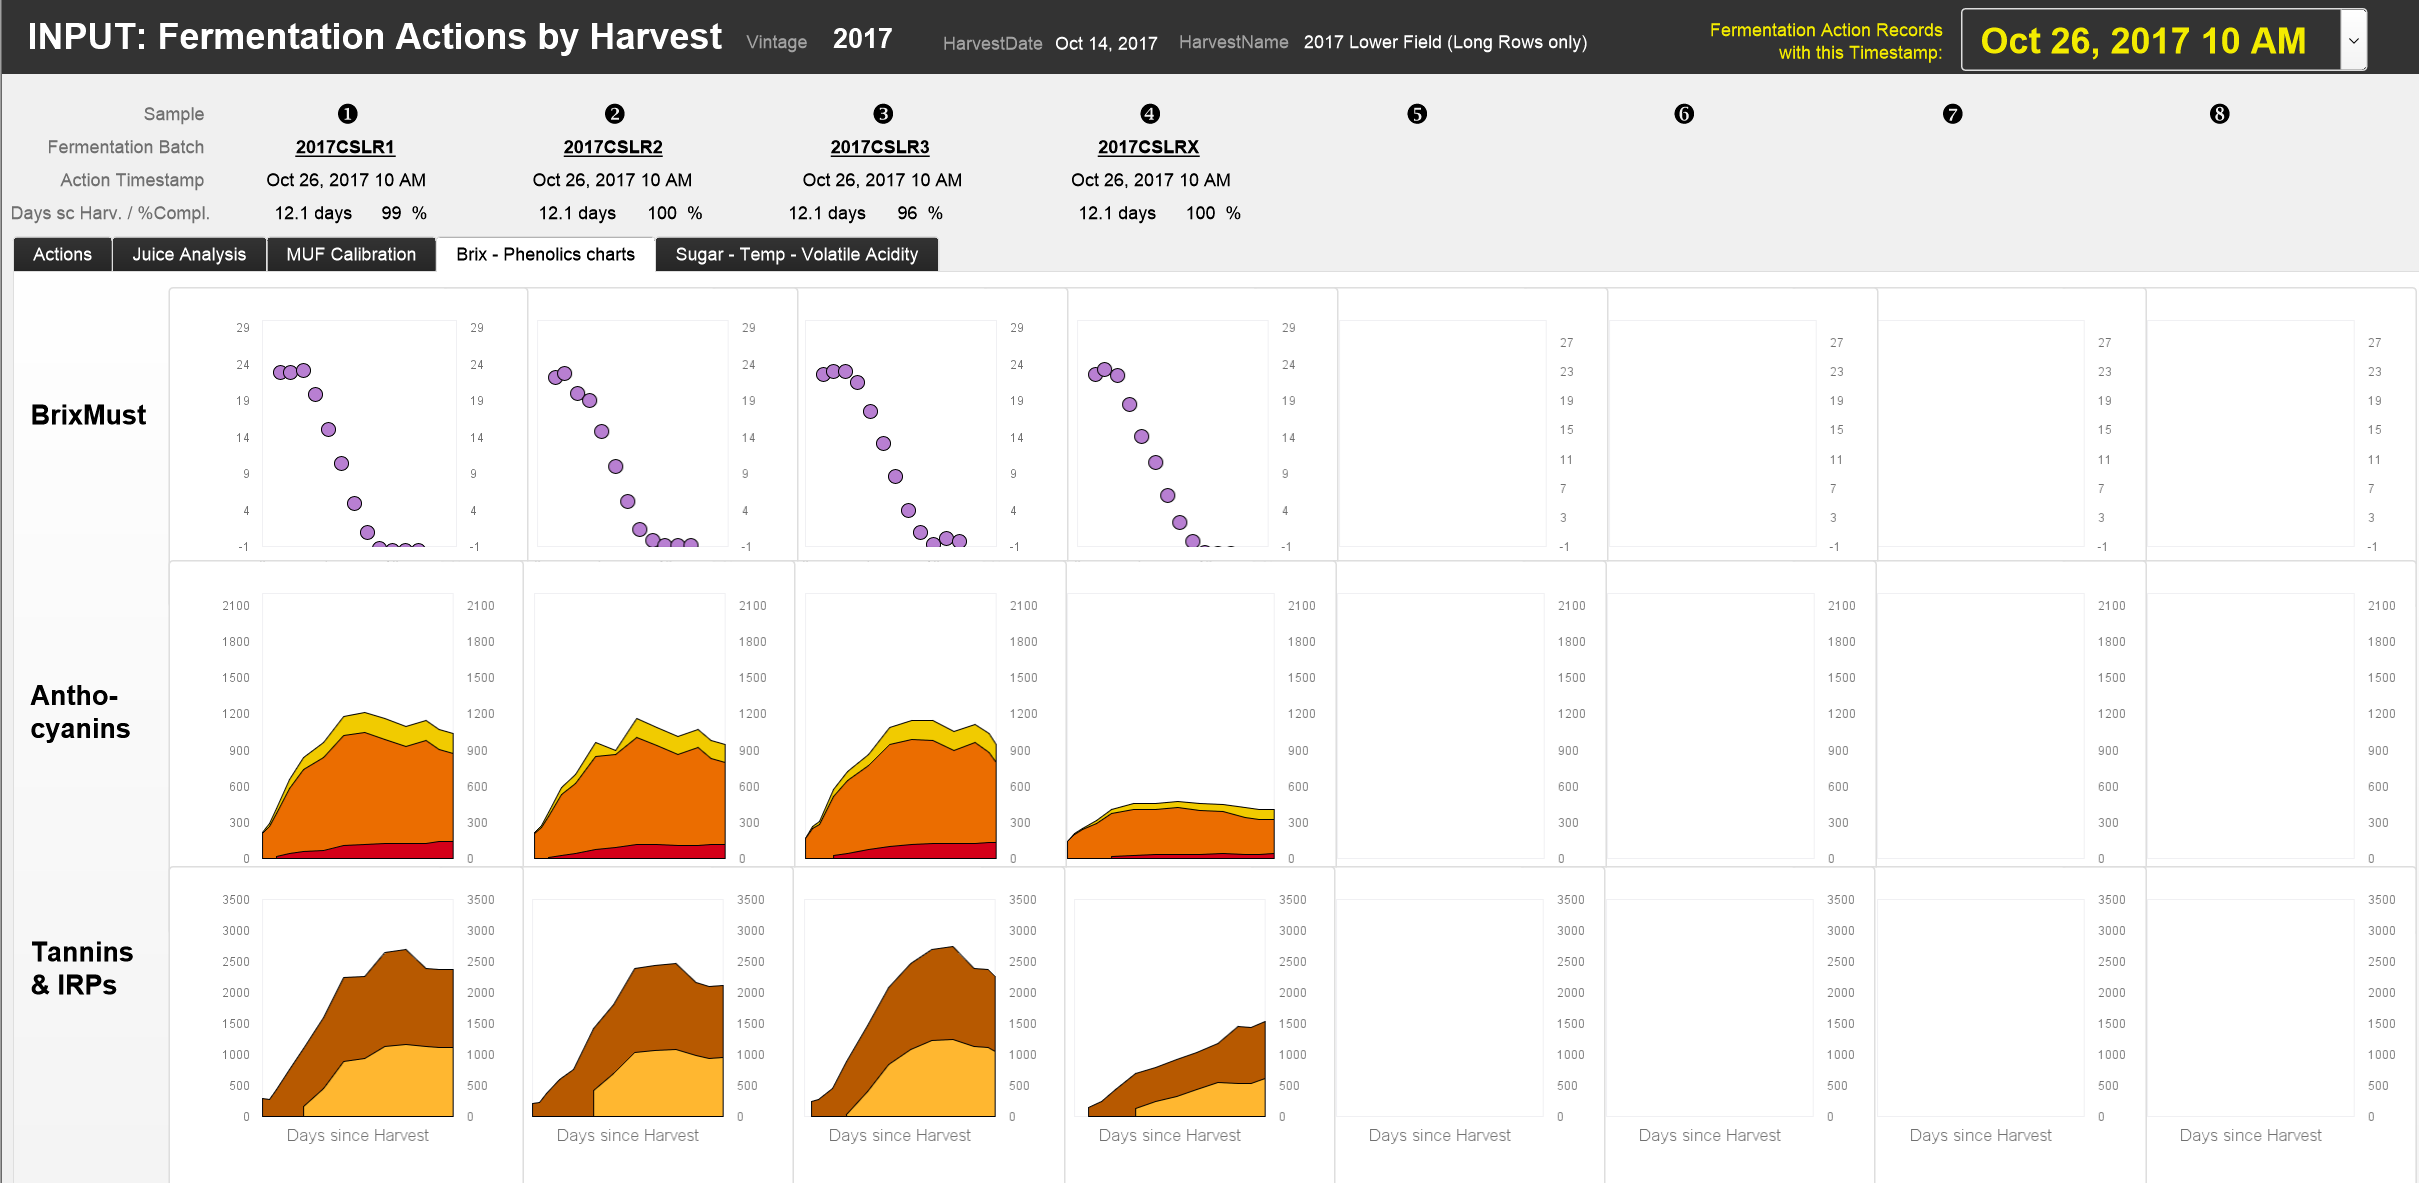
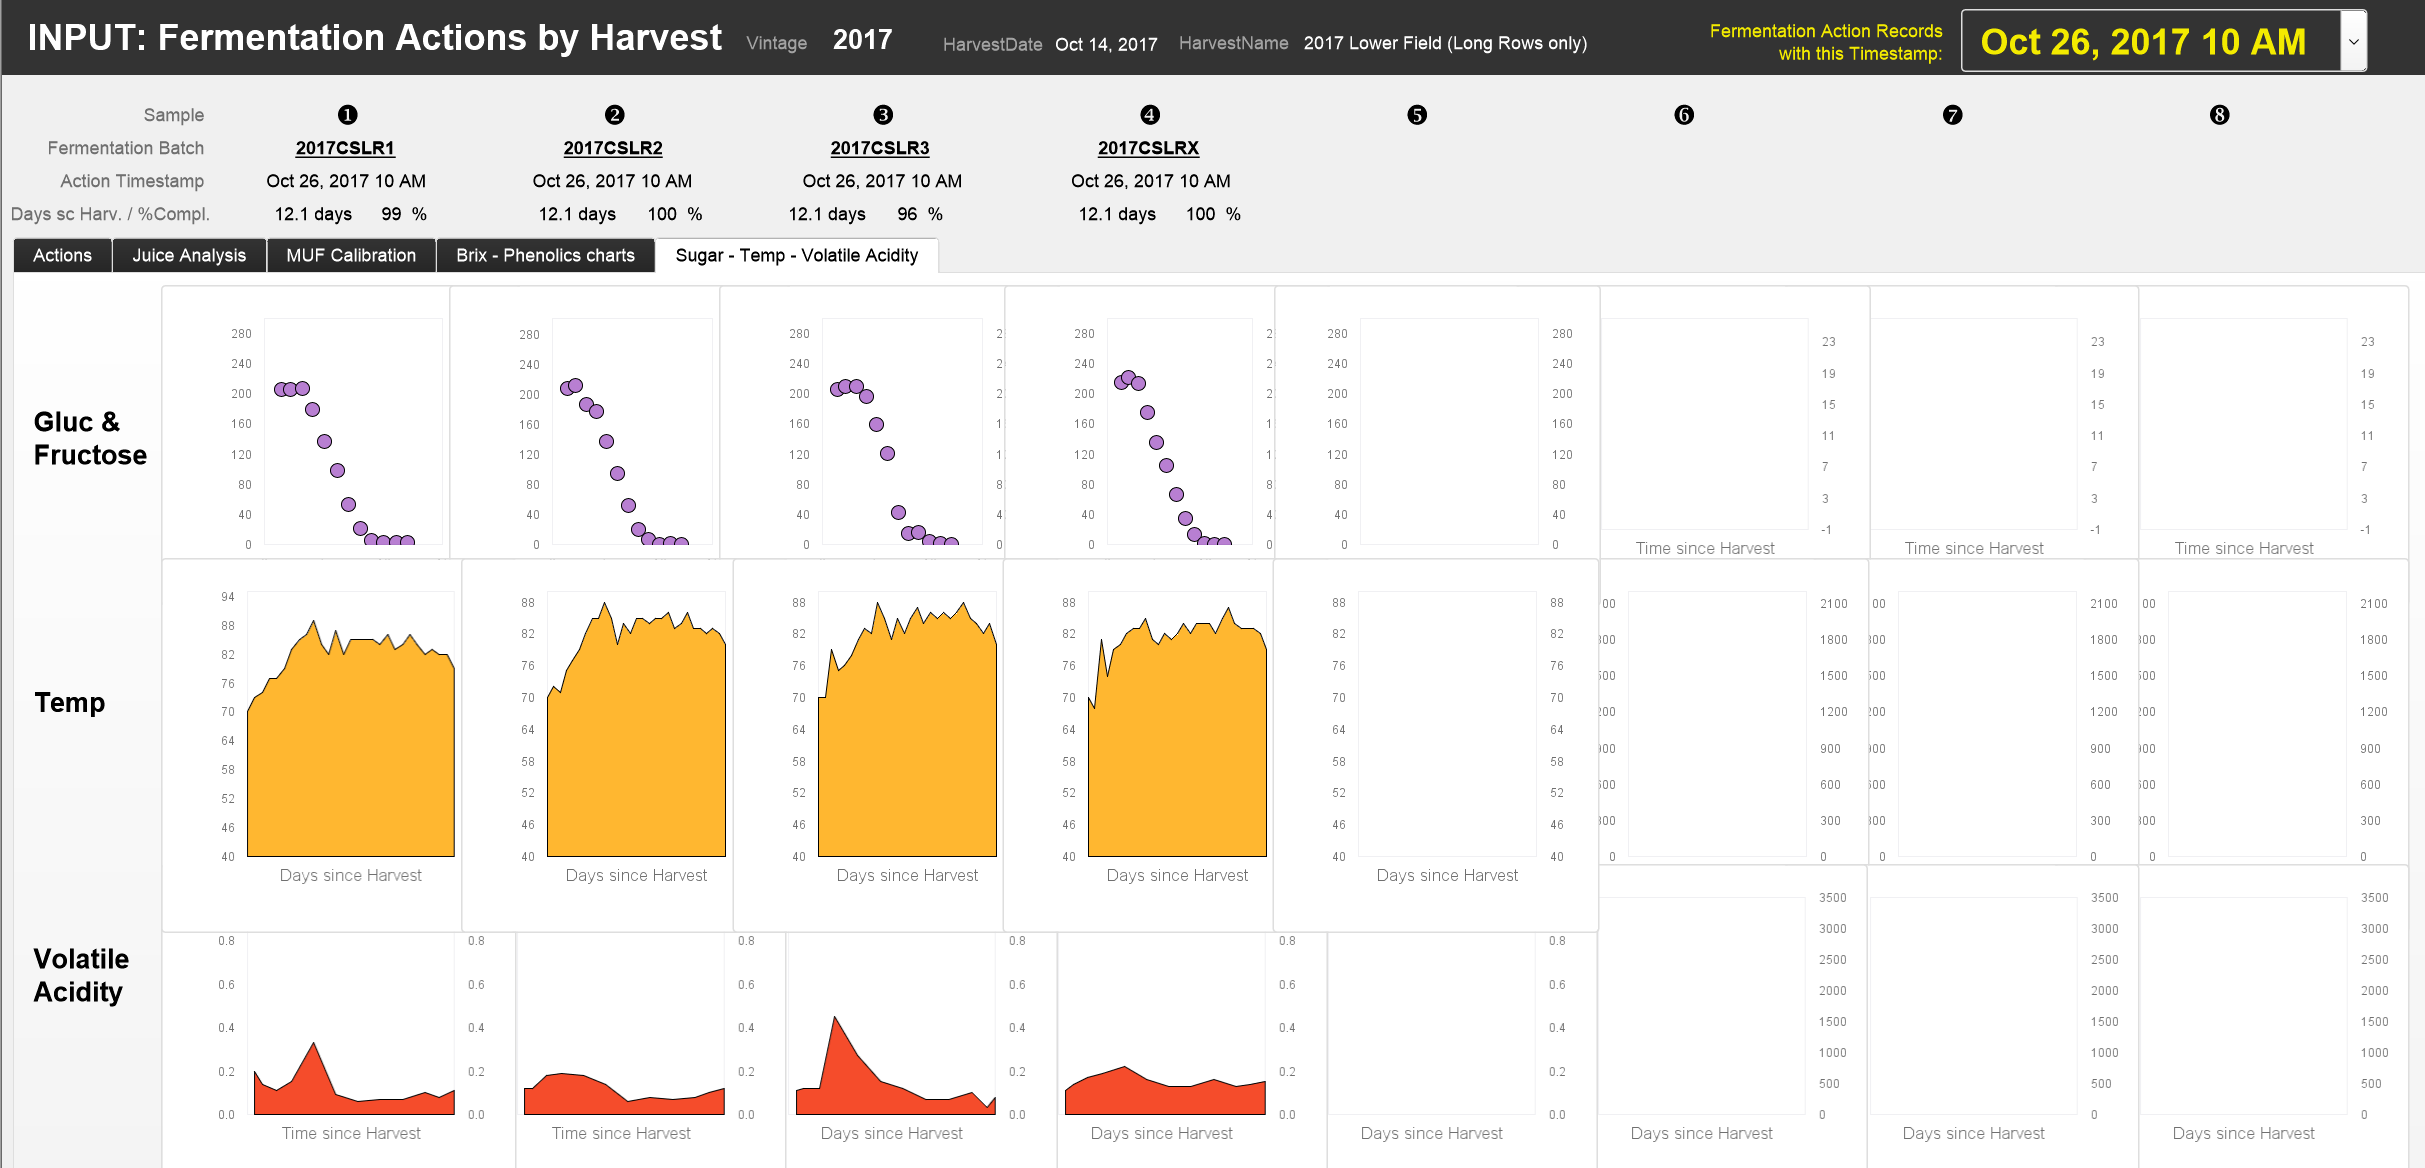
The last two tabs, Brix & Phenolics and Sugar-Temp-Volatile Acidity, show charts of how key measurements for each fermentation batch evolved. These are the key charts for monitoring the evolution of the fermentation
These screenshots show the, for examples, the charts as of October 26, 2017, of the 4 fermentation batches from the October 14, 2017, vintage of the lower field:
INPUT: CellarBatchComposition
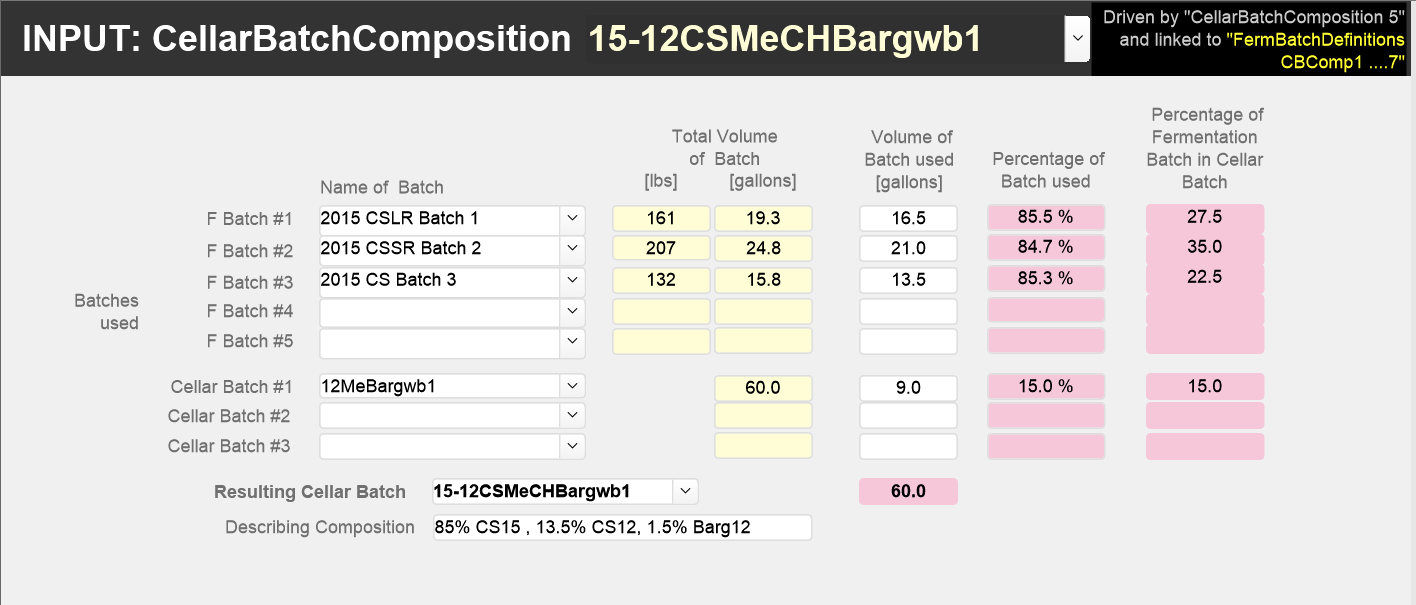
We use the layout “INPUT: CellarBatchComposition” to define the composition of a Cellar Batch. A new Cellar Batch can be composed of fractions of up to 5 Fermentation Batches and up to 2 other Cellar Batches. The layout is driven by an instance of the CellarBatchComposition table "CellarBatchComposition 5" and linked to 5 instances of the FermBatchDefinitions table "FermBatchDefinitions CBComp1 ....5" and to 3 instances of the CellarBatchDefinitions table “CellarBatchDescription CBComp6 …. 8”.This chart shows the relationships. These linked tables are in turn linked to instances of the FermActions and CellarActions tables. This graphic illustrates the relationships:


Before a Cellar Batch can be composed, a record for that Cellar Batch has to be created with the “CREATE: CellarBatch”-layout. To compose we input the CellarBatchName and the names of the constituent Fermentation Batches and Cellar Batches and their respective volumes in gallons. This is also a good time to input the CBDescription field.
These screenshots show the field names and, for example, the composition of the “15-12CSMeCHBargwb1” CellarBatch:
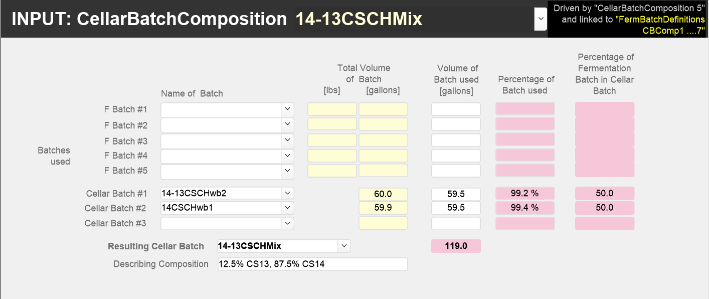
Since assemblages are a type of Cellar Batch (they are used to describe the composition of a finished bottle but consist of only Cellar Batches) we use the same input layout but specify only Cellar Batches as components. Here is a screenshot of a Cellar Batch:
INPUT: CellarBatchCollection
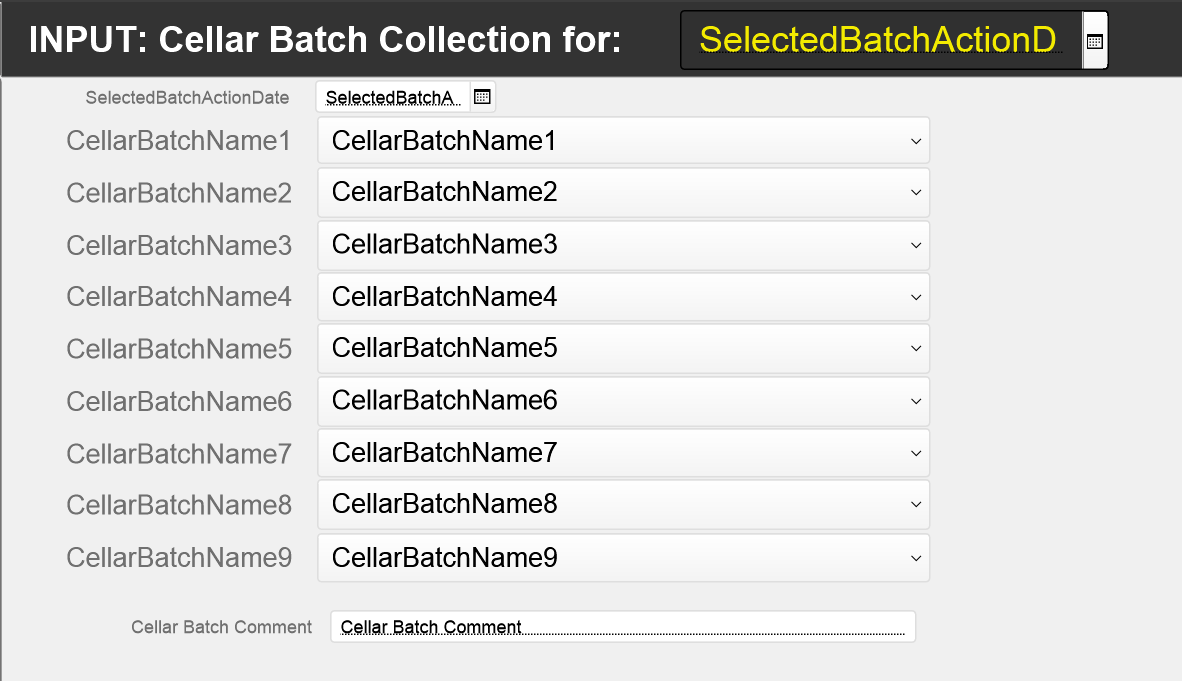
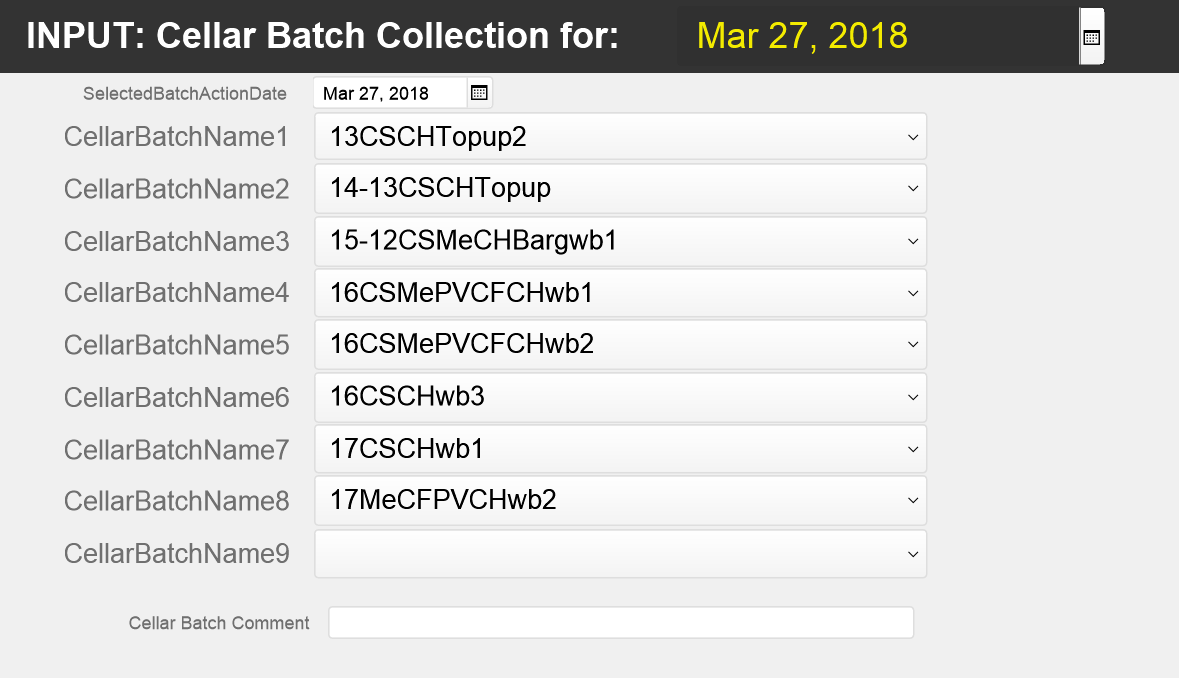
CellarBatchCollections are groupings of CellarBatches which are analysed and managed together on a particular date. CellarBatchCollection records are required to drive the “INPUT: CellarBatchAction by Collection”-layout describe below.
These screenshots show the field names and, for example, the collection used for the topping up of the barrels on March 27, 2018:
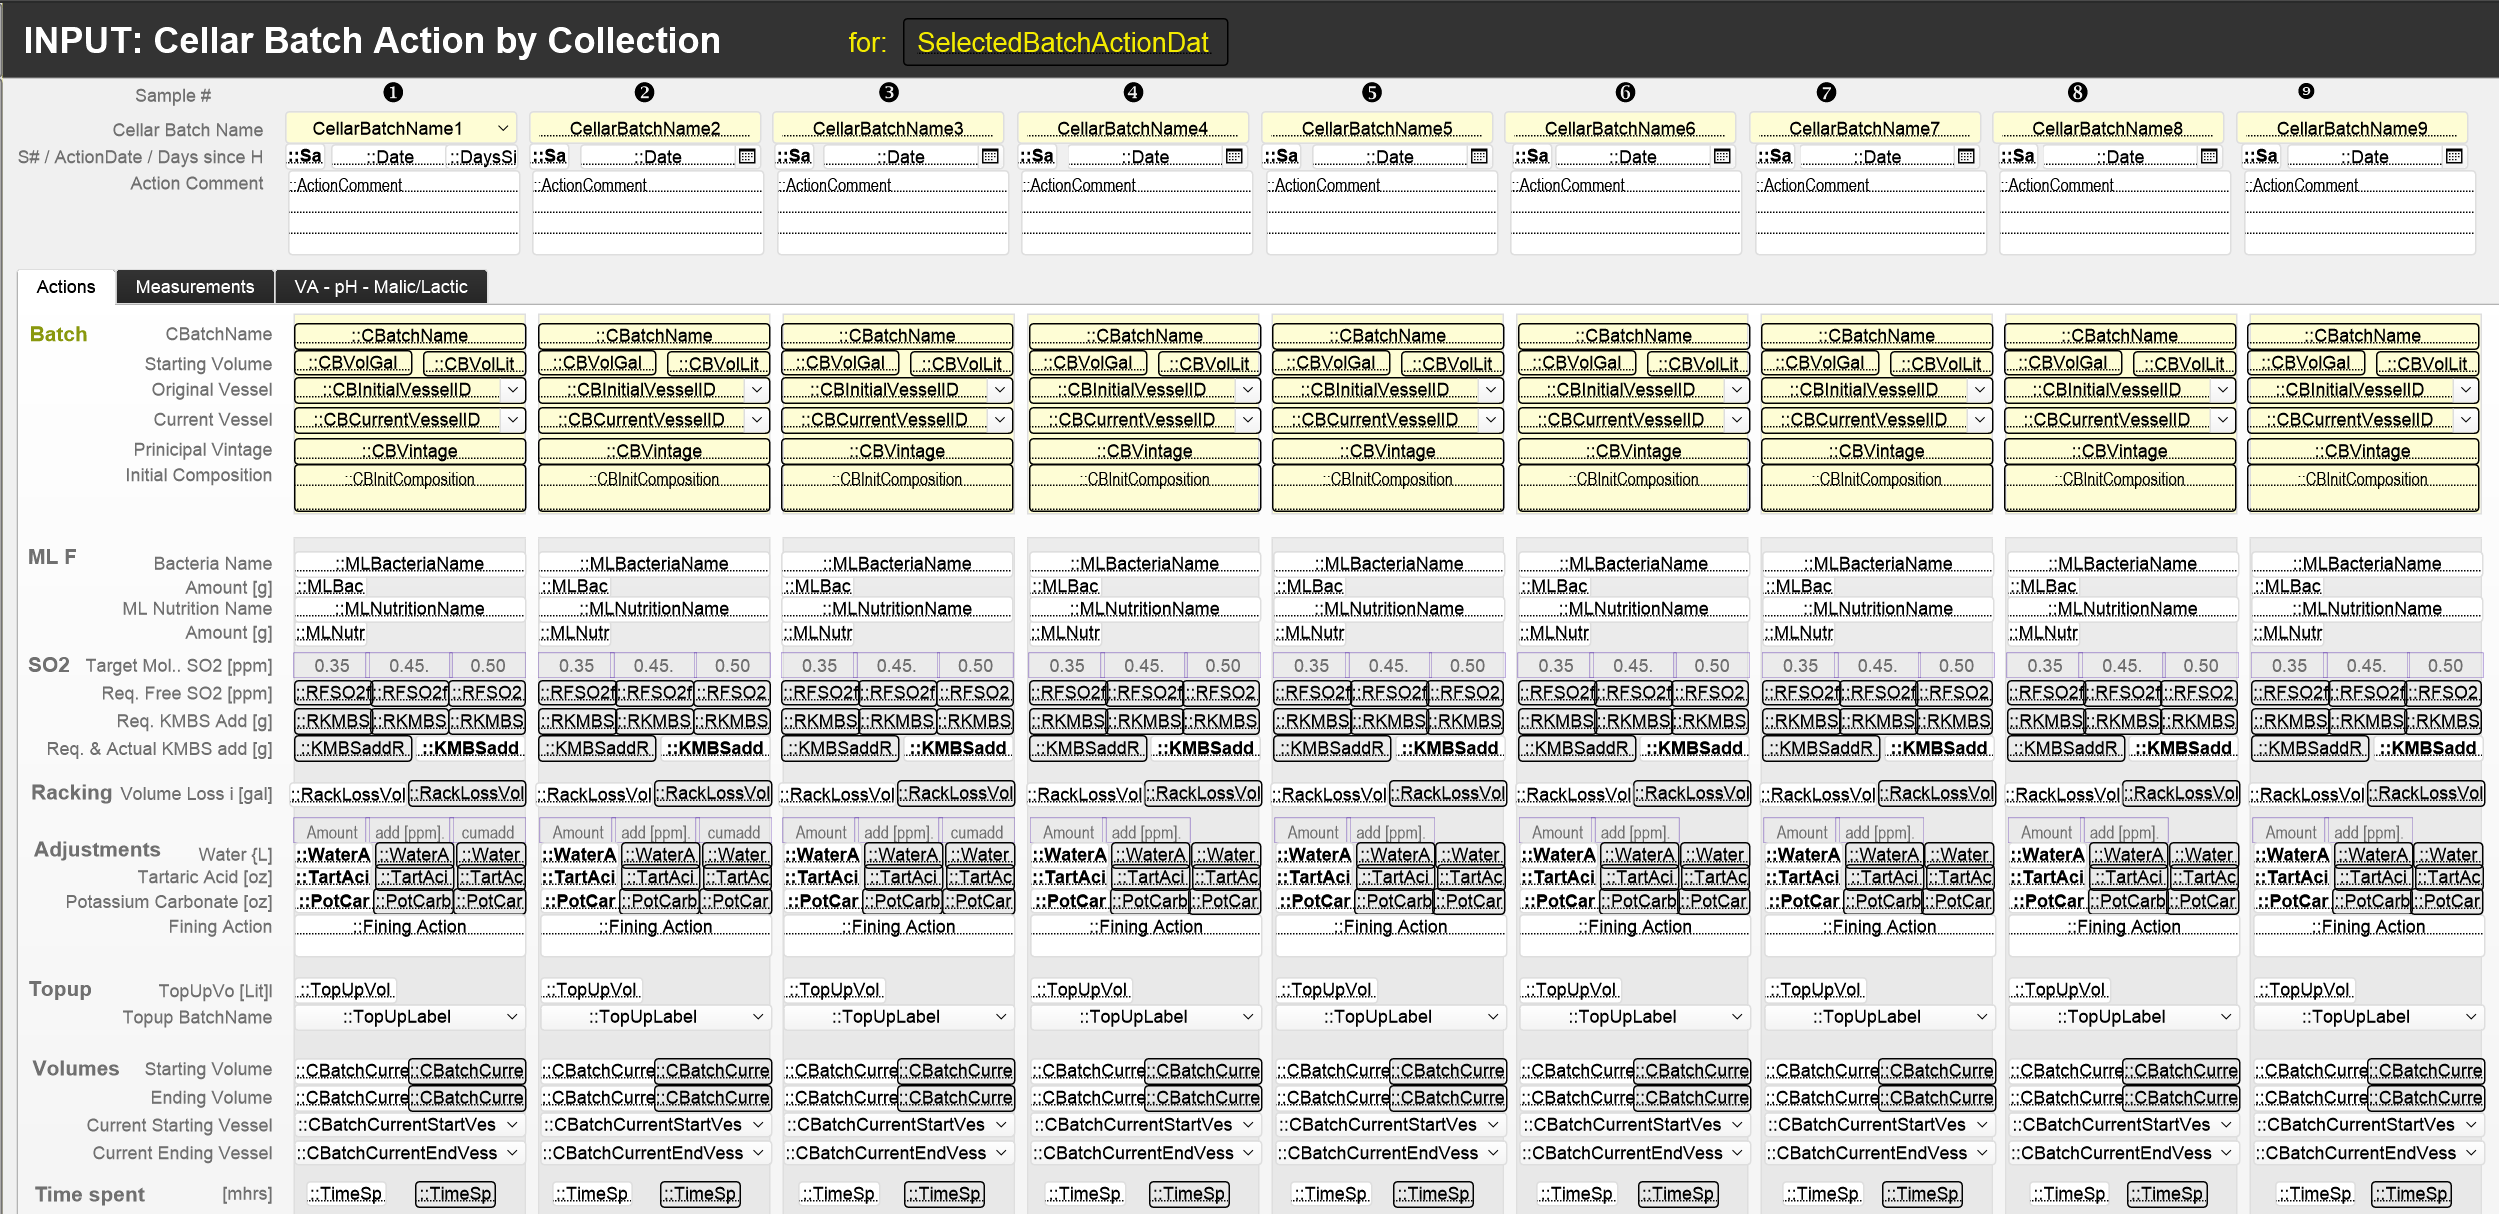
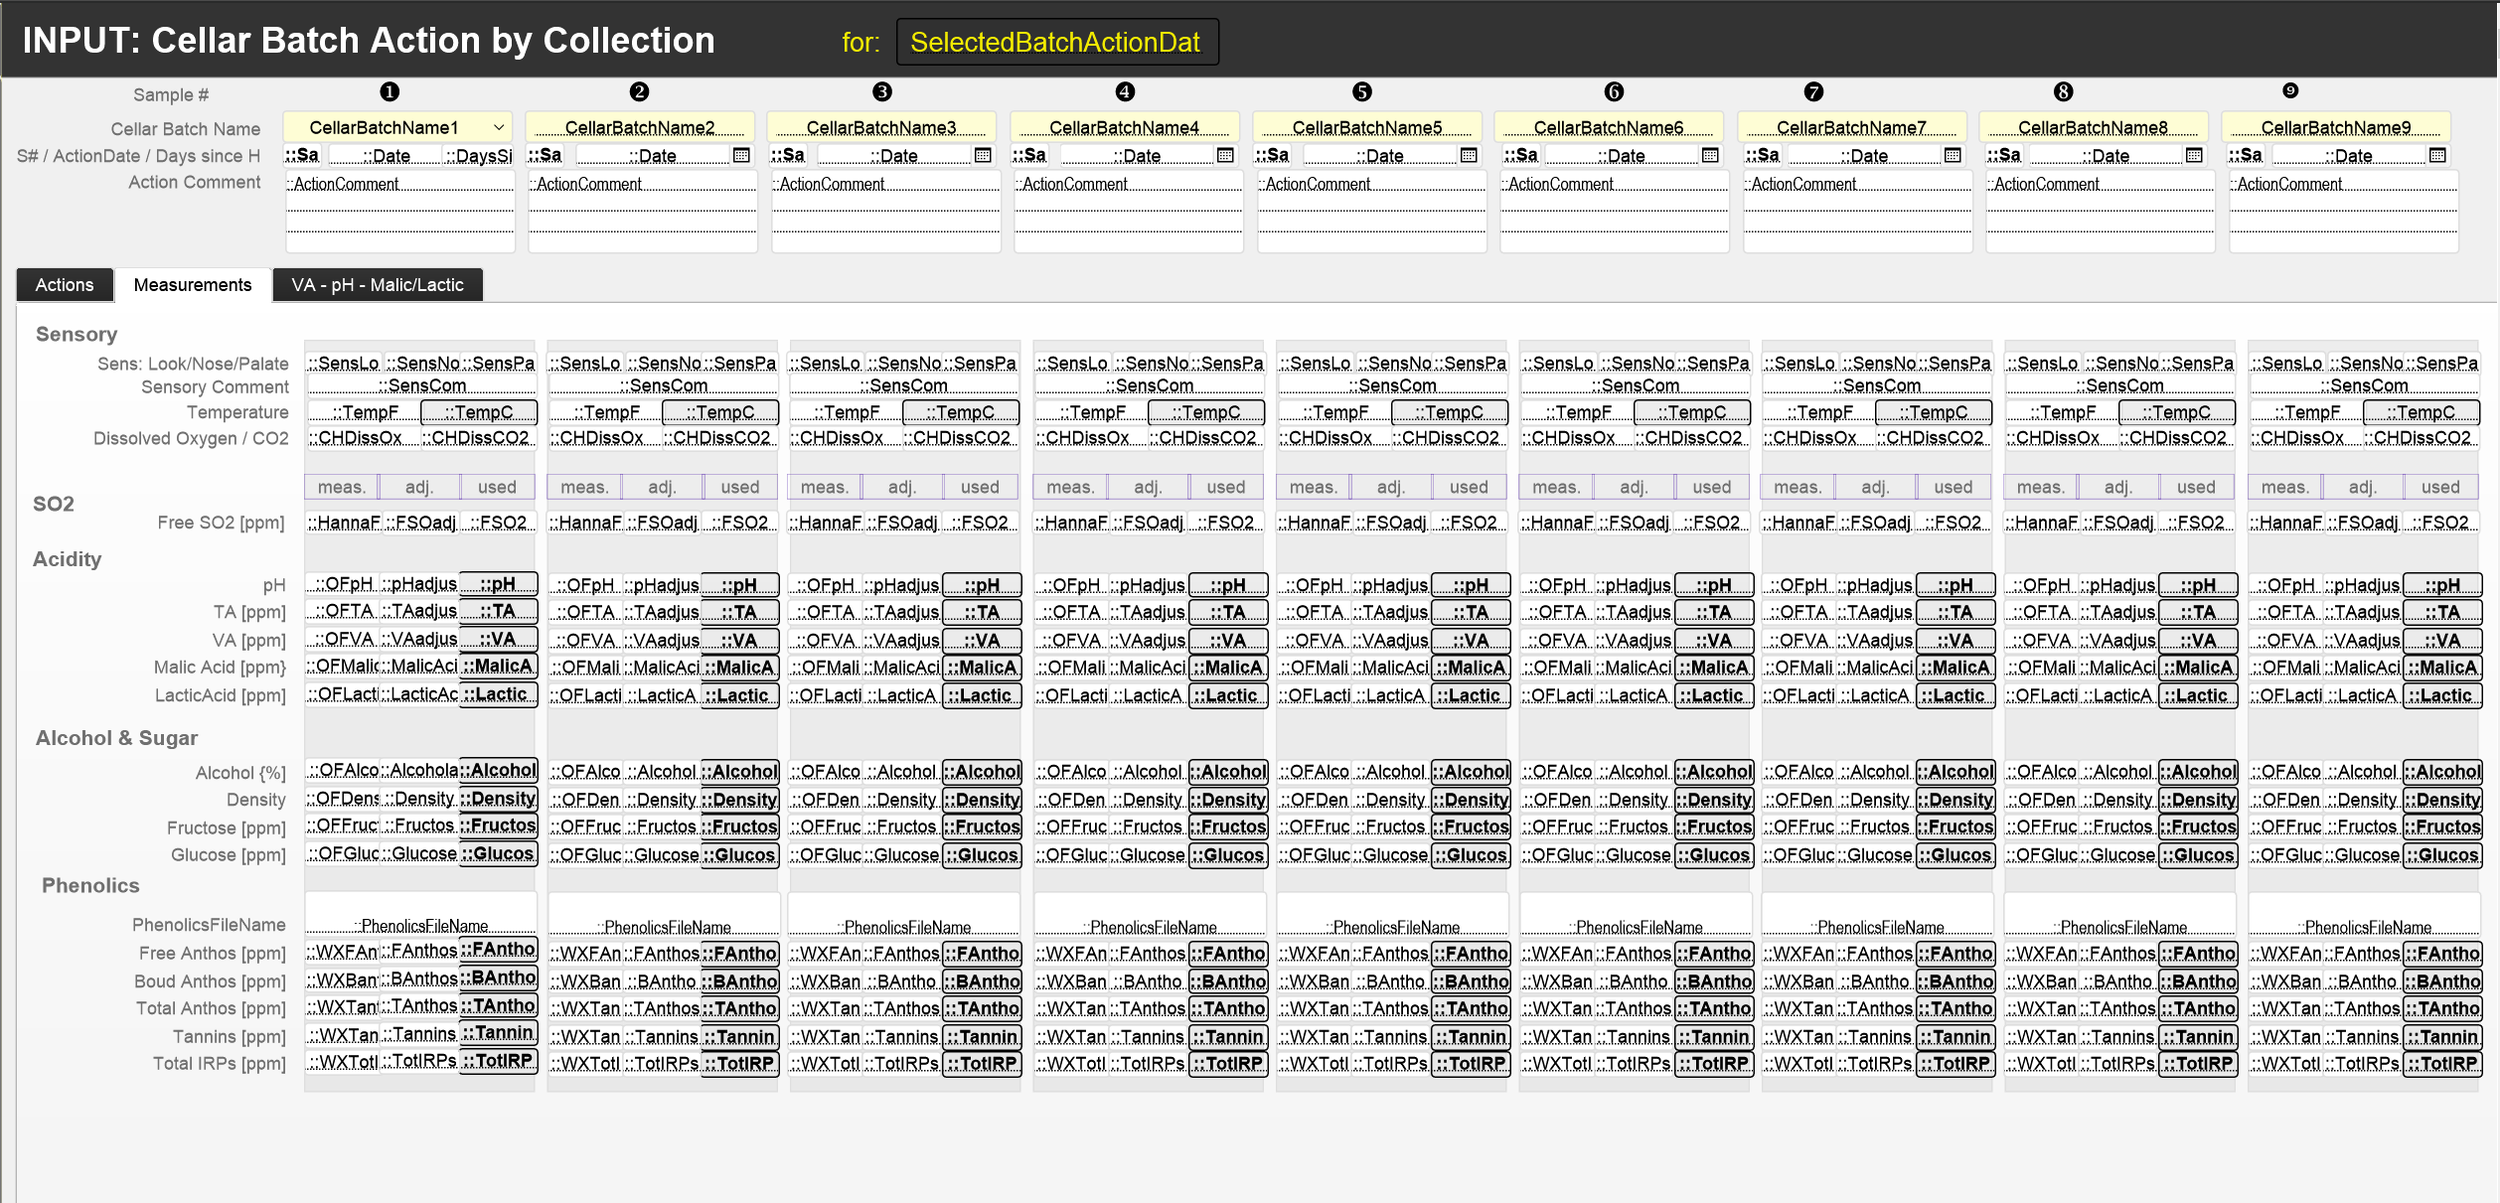
INPUT: CellarBatch Action by Collection
We manage the barrels which hold maturing wine in parallel, so we designed a data input layout so we can record data for up to 8 vessels in parallel. Each record in the CellarBatchCollection table holds the names of the vessels (mostly barrels) which are analysed on a particular date. The “CellarBatchCollection Review”-instance of this table drives this layout. It is linked to 8 instances of the CellarBatchDescription table (“CellarBatchDescription CBC1…..8”), 16 instances of the CellarActions table, 8 of which hold the data for the Cellar Action on the BatchActionDate (“CellarActions CBC1…8 AD”) and 8 which hold the data for the Cellar Actions up to and including the BatchActionDate (“CellarActions CBC1…8”). This graphic shows the links:

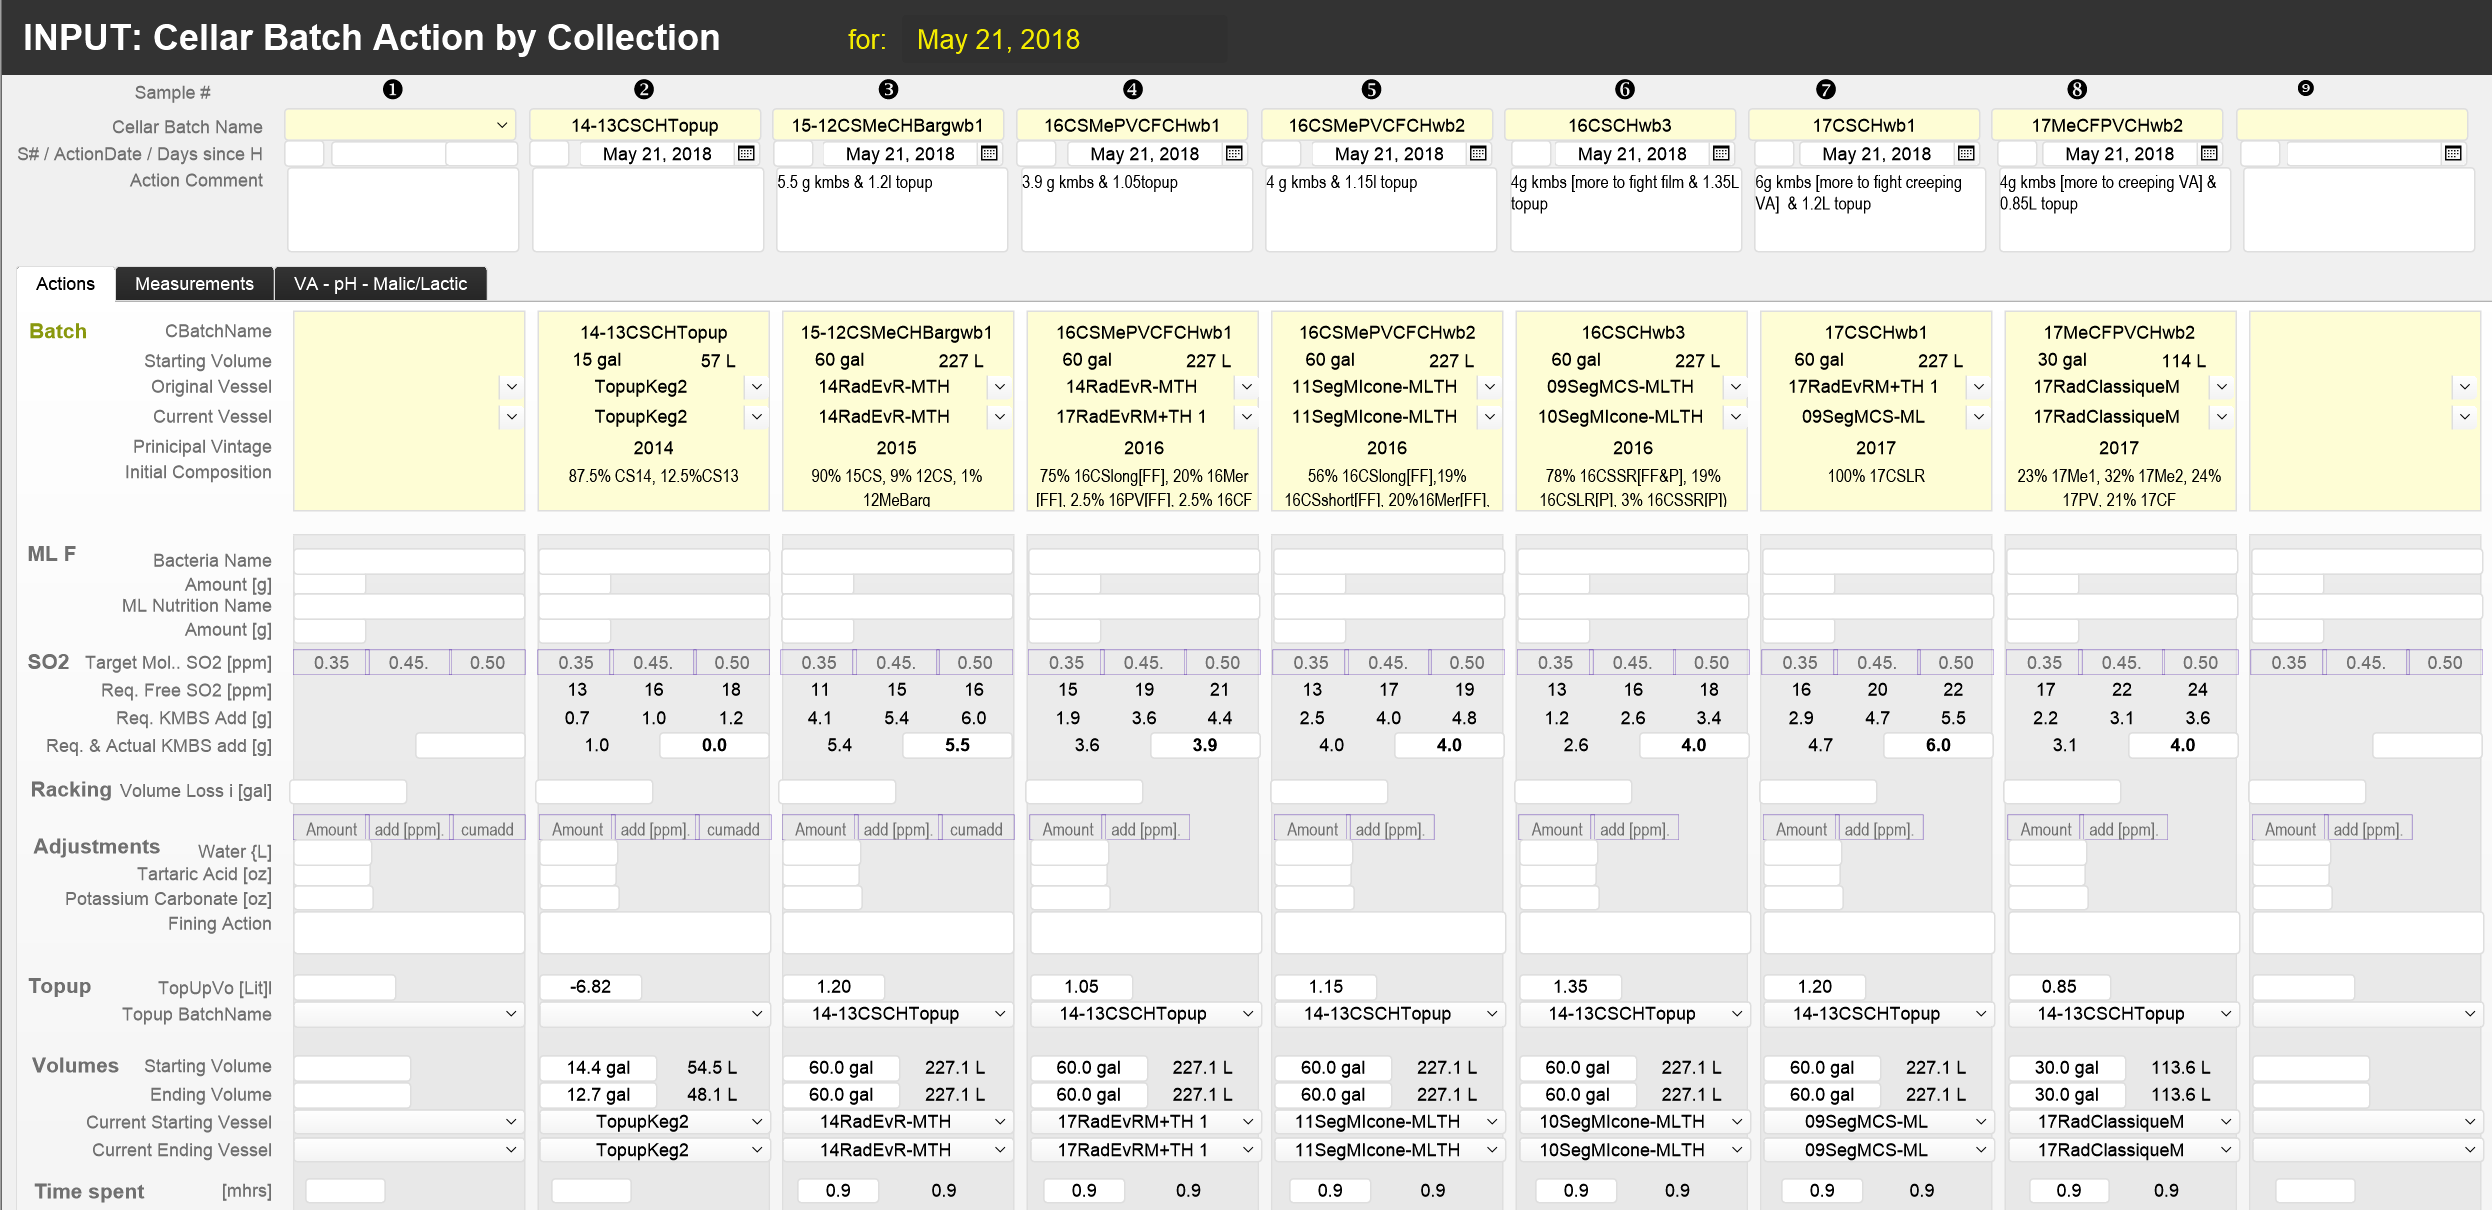
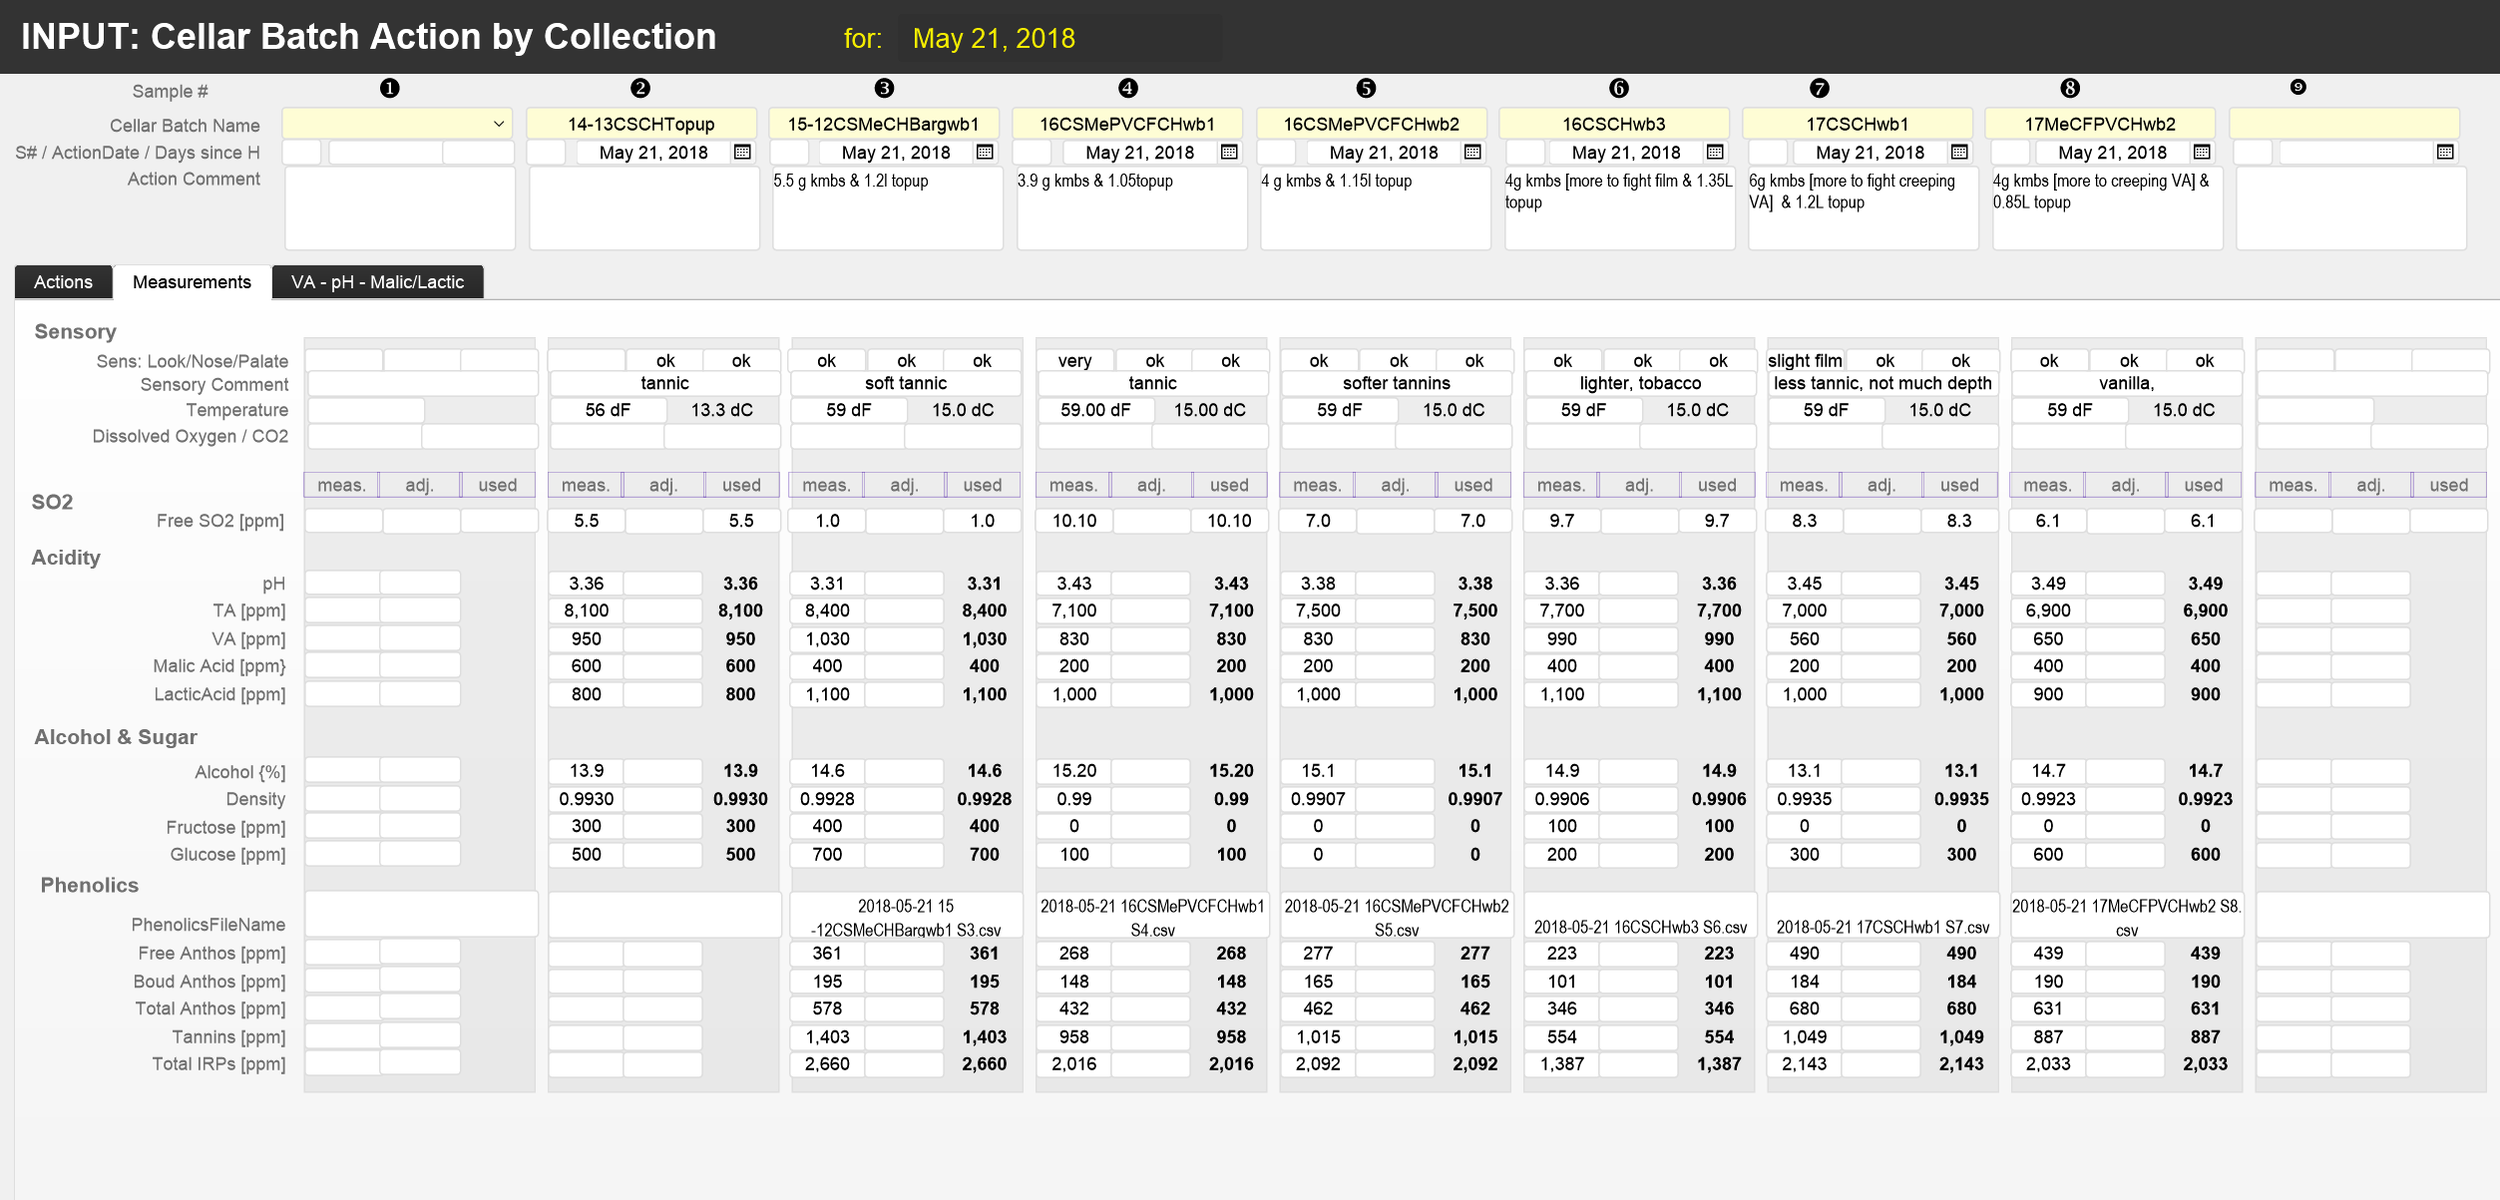
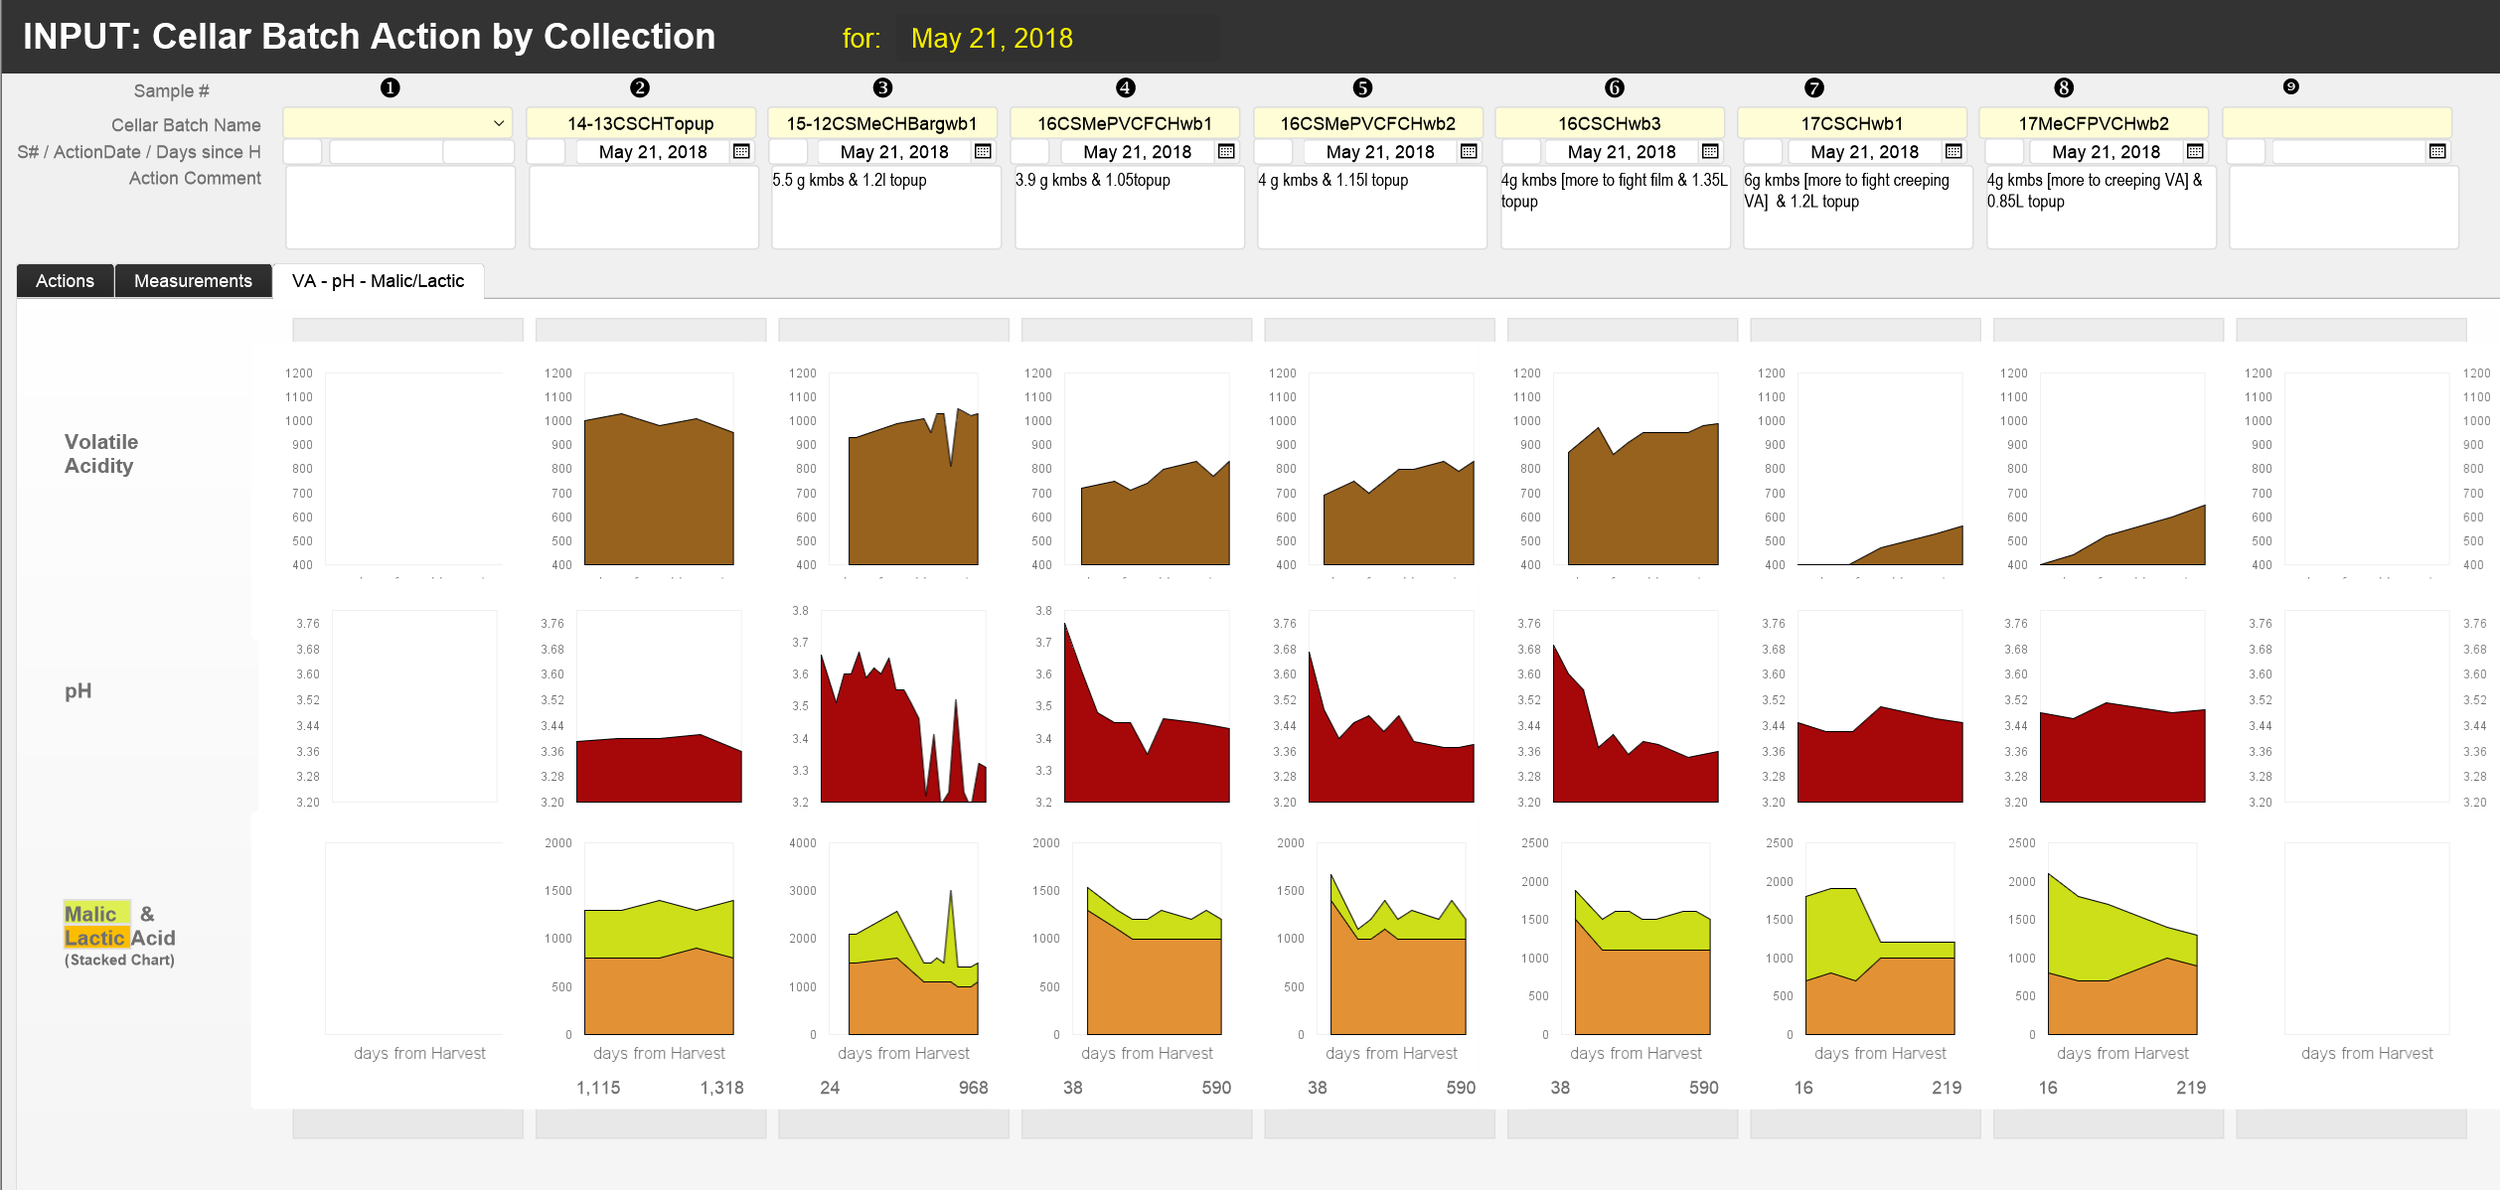
The layout has 3 tabs. We use the first, “Actions”, to describe the activities performed during a specific cellar review. These include: inoculating for malolactic fermentation, adjusting the SO2 level, racking, adjustments to acidity, fining and topping up. We use the second tab, “Measurements” to record the results from the chemical analyses of samples. The third tab reviews the results to date in for each of the vessels for volatile acidity, pH, malic acids and lactic acids. A detailed description of the fields will be added to the website at a later time.
The following screenshots show the first and second tab of the layout with the field names and, for example, all three tabs of the layout for the recordings on May 21, 2018
Previous page: Layouts to create new records
Top of this page: Go
Next Page: Layouts to review data
Last updated: August 5, 2018