Step #1: Assessing Grape Maturity
Picking the grapes at the right time is critical. Timing depends on the maturity of the grapes, the outlook for inclement weather, and a picking crew's availability. The most vital aspect is grape maturity assessment; it takes weeks.
Ideally, all grapes reach the same final level of maturity at the same time. In reality, they do not. Proper pruning and canopy management can narrow the time window of final maturity so we can harvest all grape bunches on the same day. We sample the grapes in the vineyard every week and test them – when the average reaches specific characteristics, we pick. There are four aspects to consider in getting to the picking decision:
Weather and soil humidity: how much sunshine have the grapes received over the growing season and how much water was added through irrigation to fine-tune the grapes’ condition during the last 4-5 weeks?
Sampling: How do we sample the grapes to be analyzed so the sample represents the range of maturity in the entire vineyard?.
Chemical Analysis: what chemical measurements do we take to decide whether the grapes have reached maturity and how will the results affect our winemaking process?
Taste Analysis: how can we consistently evaluate the taste of the grapes during their final weeks of maturation?
Finally, we try to forecast, as we measure, when we will likely end up picking and what volume we can expect from the harvest. Quality, date, and volume forecasts help us organize the picking crew/party and decide on the subsequent fermentation processes.
The following paragraphs explain what we do in detail.
Weather and soil humidity
On the last page in the vineyard section, we described how we monitor weather conditions during the growing season. A critical weather-related leading indicator for maturity used throughout agriculture is Cumulative Growing Degree Days (“CGDD”). We track this number throughout the year and pay particular attention during the last four weeks. The goal is to reach around 2000 CGDDs before picking.
We can increase soil humidity with irrigation. We do not irrigate the vineyard except in very dry seasons and during the final weeks of maturation if we need to prevent sugar from shooting beyond our target of 24 Brix before the grapes have reached physiological maturity (as measured by Taste Analysis). Consequently, we track CGDDs, temperature lows and highs, humidity lows and highs, and irrigation amounts during the final weeks.
Sampling
The second task is to decide how we sample. The goal is to sample in the areas which provide the full range of berry maturities. The best time to easily spot degrees of berry maturity is during veraison, when the berries turn from green to blue. So we look at
The planting map to make sure we sample all the different clones
The veraison map when 90% of the berries are blue to make sure the maturity differences are representative for the entire vineyard, and
The projected crop load map to make sure we have enough fruit to sample
In 2017 we selected, as in 2016, six sample areas.
In the Lower Field: the north-east corner of the long rows to sample the “Freedom” and “4453” roots with 337 cabernet clones. In the northeast corner of the short rows to catch the “110R” roots with “Dr. Emmet Rixford” cabernet clones, and the boundary between the short and long rows to capture the 2009 replantings, i.e., clone 337 on 4453 roots.
In the Upper Field: The first half rows for each varietal. The graphic below shows the three maps and the selected sampling areas. The assumption is that differences in the maturity levels now, near picking, would be similar to the readily observable differences during veraison.

In 2018 we changed the selection of sampling areas because, both in 2016 & 2017, the sample results did not match well with the observations at harvest (for one, the final projected Brix levels were 2-4 Brix lower than what we got at harvest). So, in 2018 we sampled each block in the lower field uniformly, and we sampled the middle row of each block in the upper field.
Sample size: We collect weekly samples of 110 berries each, 100 berries for chemical analysis, and 10 berries for taste analysis for each block.
Chemical Analysis
We take a whole range of measurements and, from them, calculate sample averages.
Sugar content (Brix): The sugar content of grape juice is the most straightforward measure of maturity. The industry norm is to pick when the sugar level has reached 22-28 Brix, depending on the style of the wine desired. Our target is 23.5 Brix when the juice is in the fermentation tank, but we focus more on maximizing potential Anthocanins (see below)
Acidity (pH and Total Acidity, TA): At maturity, we expect a pH range of 3.3 to 3.5 and a TA range of 6 to 9 [g/L]. We also capture Tartaric, Malic & Gluconic Acids but are unsure what we do with the numbers. Finally, we capture Volatile Acidity to detect bacterial infestations.
Nutrients (Alpha Amino Acids and Ammonia, which sum up to YAN, Yeast Assimilable Nitrogen): These are vital benchmarks for nutrition available for yeasts during fermentation. We target YANs of 250 ppm; below that, we need to add nitrogen during fermentation.
Projected Anthocyanin content (tANT): Anthocyanins are responsible for the finished wine's color intensity and mouthfeel. We press the sampled berries, then expose the skins and seeds to an alcohol solution at 130 OF for 2 hours, then press again and measure the phenolic components extracted by the alcohol solution. Our goal is to pick at the peeck of tANT, prefereably above 2,000 ppm.
We describe the laboratory processes in the Laboratory Section.
Physical Analysis
An alternative measure is to assess the maturity of the grapes by tasting their skin, pulp, and seeds individually. L’Institut Cooperatif du Vin (ICV), a wine advisory cooperative in Montpellier, France, has developed a handy methodology that we used in the past. It requires judgment for rating 18 different characteristics on a scale from 1 to 4. See the table below for the form we used:

The process is:
Step 1: Visual Inspection. Inspect the 4-5 berries and rate 1) the elasticity of the berry, 2) the color of the skin around the stalk, and 3) how easy it was to remove the stalk.
Step 2: Pulp Tasting. Squeeze the pulp of the 4-5 berries into your mouth, separate the seeds with your tongue, and keep the seeds for the last step. While doing that, evaluate 4) how easy the pulp detached from the skin, 5) the sweetness of the juice, 6) its acidity, 7) its herbaceousness (herbal aroma), and 8) its fruit aroma. This takes some experience as all the ratings have to be done within 10 seconds.
Step 3: Skin Tasting. Put the skins into the mouth and chew them hard 15 times or until they have entirely disintegrated into mush. Then evaluate 9) the level of disintegration after 15 chews, 10) the tannin intensity, 11) the astringency, 12) the skin acidity, 13) the herbaceousness, and 14) the fruit aroma.
Step 4: Seed Evaluation. First, rate 15) the color and 16) the hardness of the seeds. If the rating is 3 or 4, chew the seeds and rate 17) their tannin intensity and 18) their astringency.
As the berries mature, the ratings move from 1 towards 4. Not all ratings reach 4 before the Brix level of the berries becomes excessive, or the weather turns too cold to finish maturation, and the grapes need to be picked regardless. The final scores provide input to winemaking to adjust the fermentation and maceration styles. We used this ICV process from 2013-2016 and then concluded it was inappropriate for our situation. We have far too few samples to benchmark our judgments accurately. So in 2017, we returned to a more straightforward approach: we rate how berries look, feel and taste using a range of 1 to 4 (from immature to fully mature). Essentially, we use an abbreviated ICV process.
In summary: We endeavor to pick when the CGGD passed 2000, the sugar levels have passed 24 Brix, the average of average ICV scores exceeded 3.5, and the Anthocyanin levels are peaking.
Forecasting quality, date, and volume of harvest
Our quality forecasts are based mainly on the physical appearance of the bunches (e.g., mildew damage, bird damage, shrivel) and the projected potential Anthocyanin levels.
Our harvest date forecasts are based on the observed Brix level and the historical experience on how fast Brix levels increase over time at given ambient temperatures. The graphic on the right shows that in 2012 through 2015, the sugar levels have increased on average between 0.8 to 1.4 Brix/week. However, as shown in the graphic, there is no convincing correlation between that number and the average temperature during the week.

We also consider the observed evolution of potential Anthocyanin content and estimate when the peak will likely occur.
Our gross volume forecasts are based on estimates for each vine at veraison how big the current fruit load is as a percentage of estimated maximum load and averaging these numbers over each row. Then we estimate the maximum fruit load in pounds for each varietal and multiply it with the average observed fruit load to get to an estimated harvest volume per row.
The quality and date forecasts are updated every week as we take and analyse our samples.
Data Management
We record observations for our six vineyard blocks in a single layout. The following screenshot shows, for illustration, the recordings on September 10, 2018. Since 2016, we use an Oeno FOSS analyzer to measure the acidity, sugar, and nutrient levels. For estimating potential anthocyanins, we use WineXRay. The Laboratory section provides details on the measurement protocols.

We monitor the progress of berry maturation and adjust the projected harvest dates after we enter the results of the berry tests. This screenshot shows the layout to review and adjust the dates on October 1, 2018:

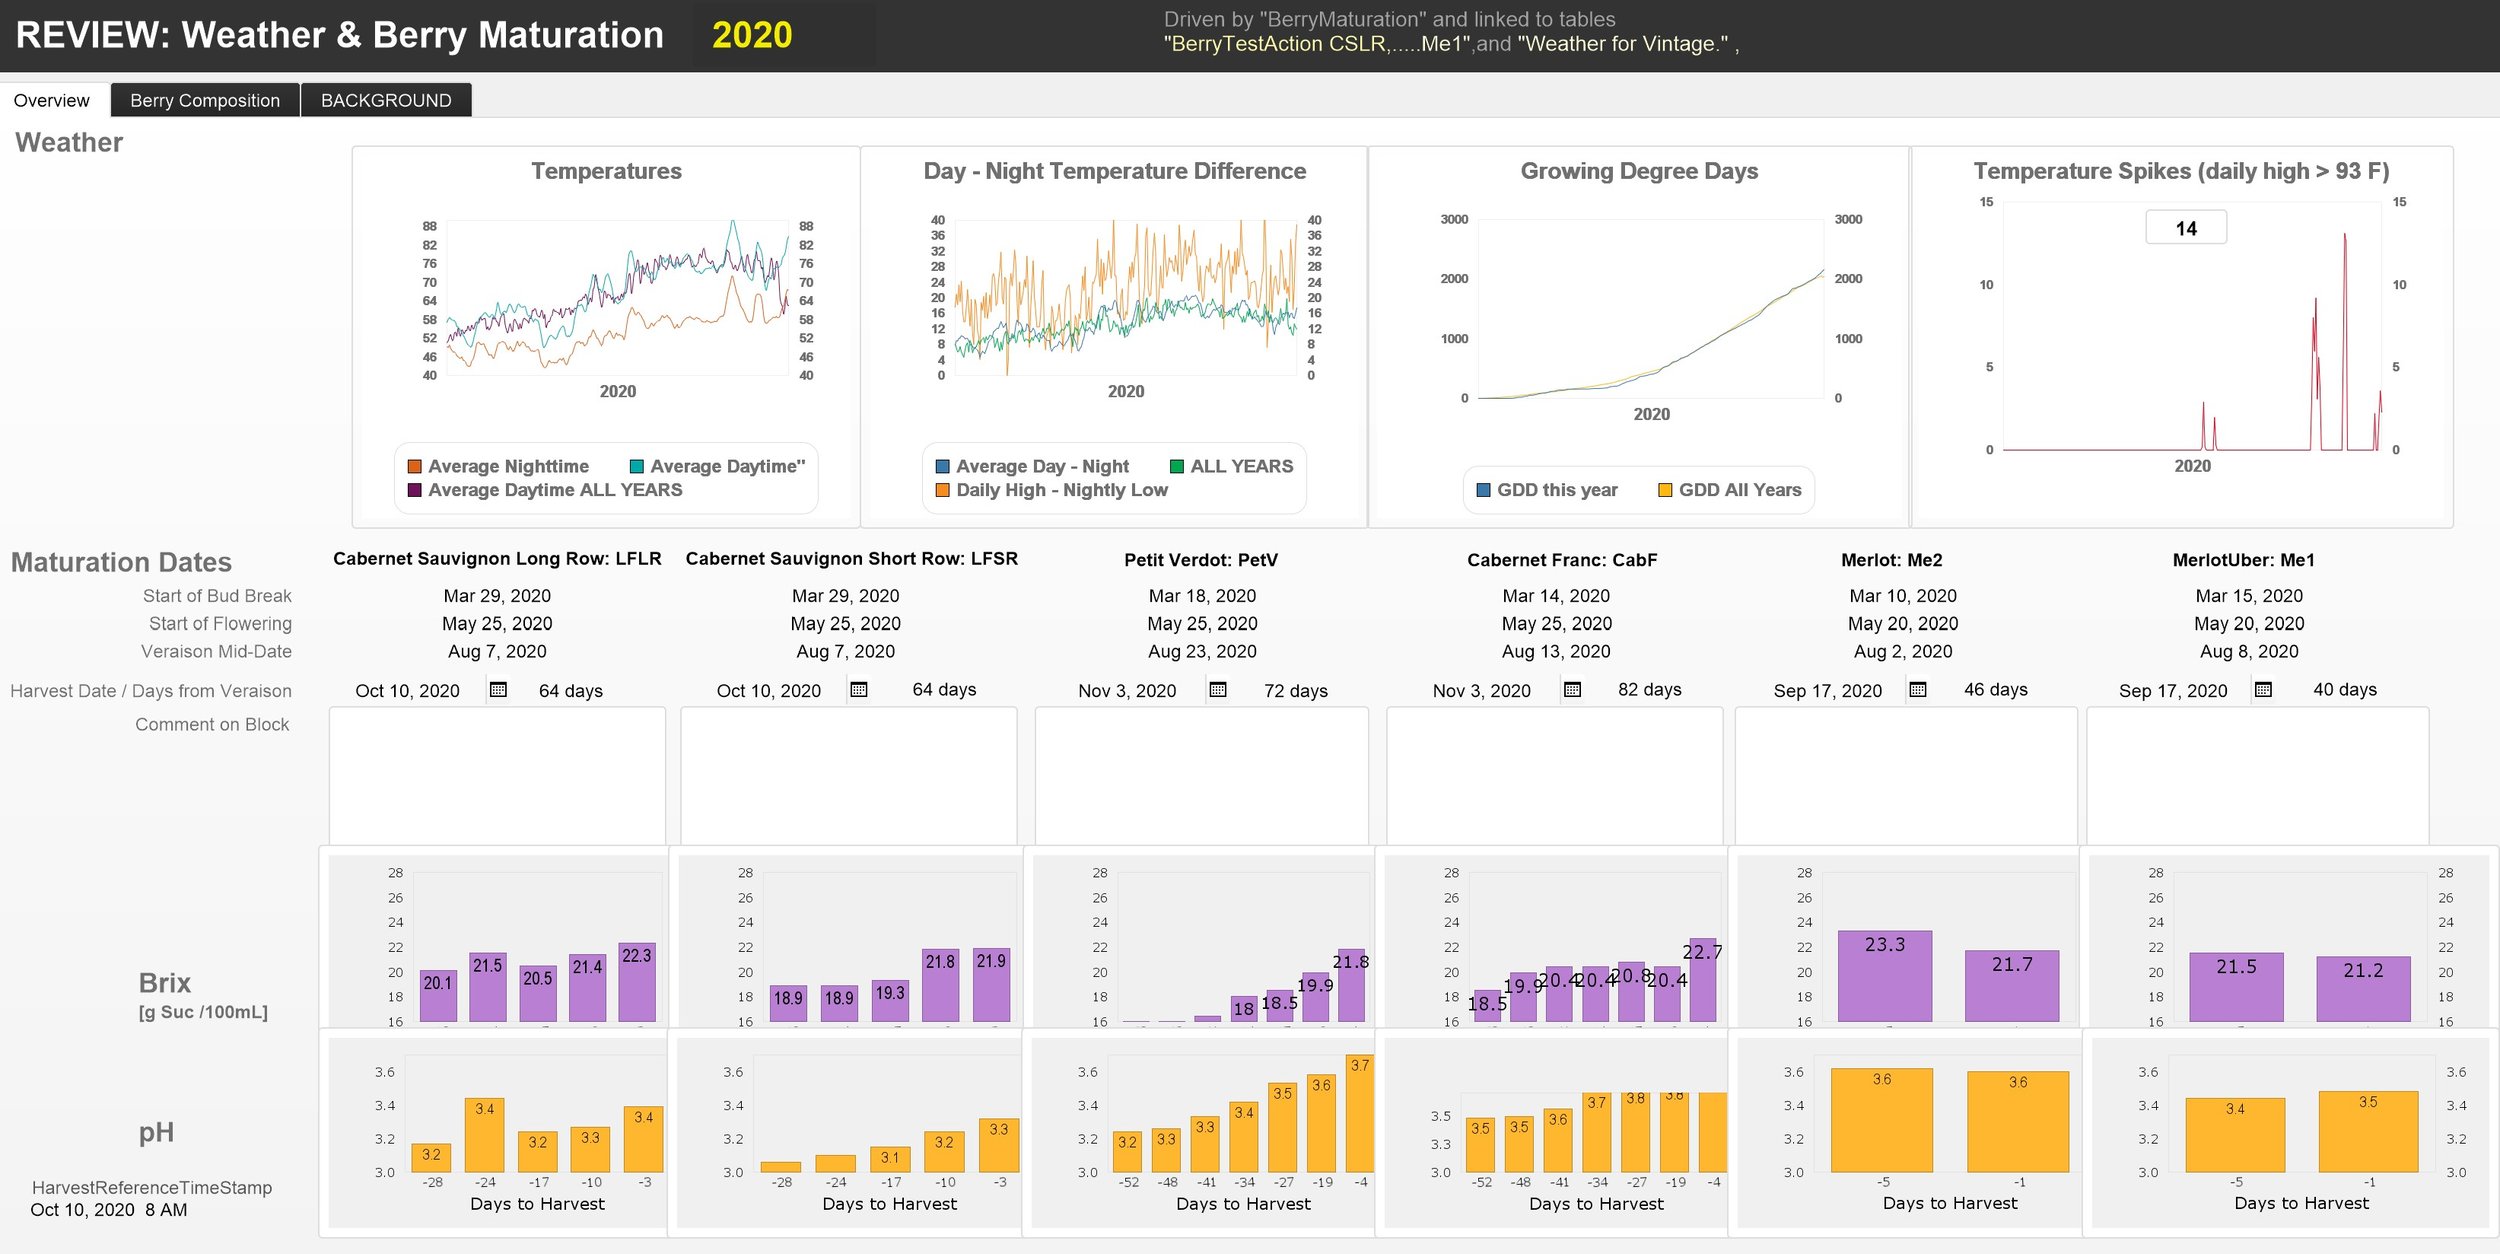
Tracking Results for the 2020 crop
The first tab in the layout “REVIEW: Weather & Berry Maturation” shows the maturation dates and Bric and pH levels measured in the berry tests for each block. Note, we started berry testing a bit late, so there were only two tests for the Merlot blocks
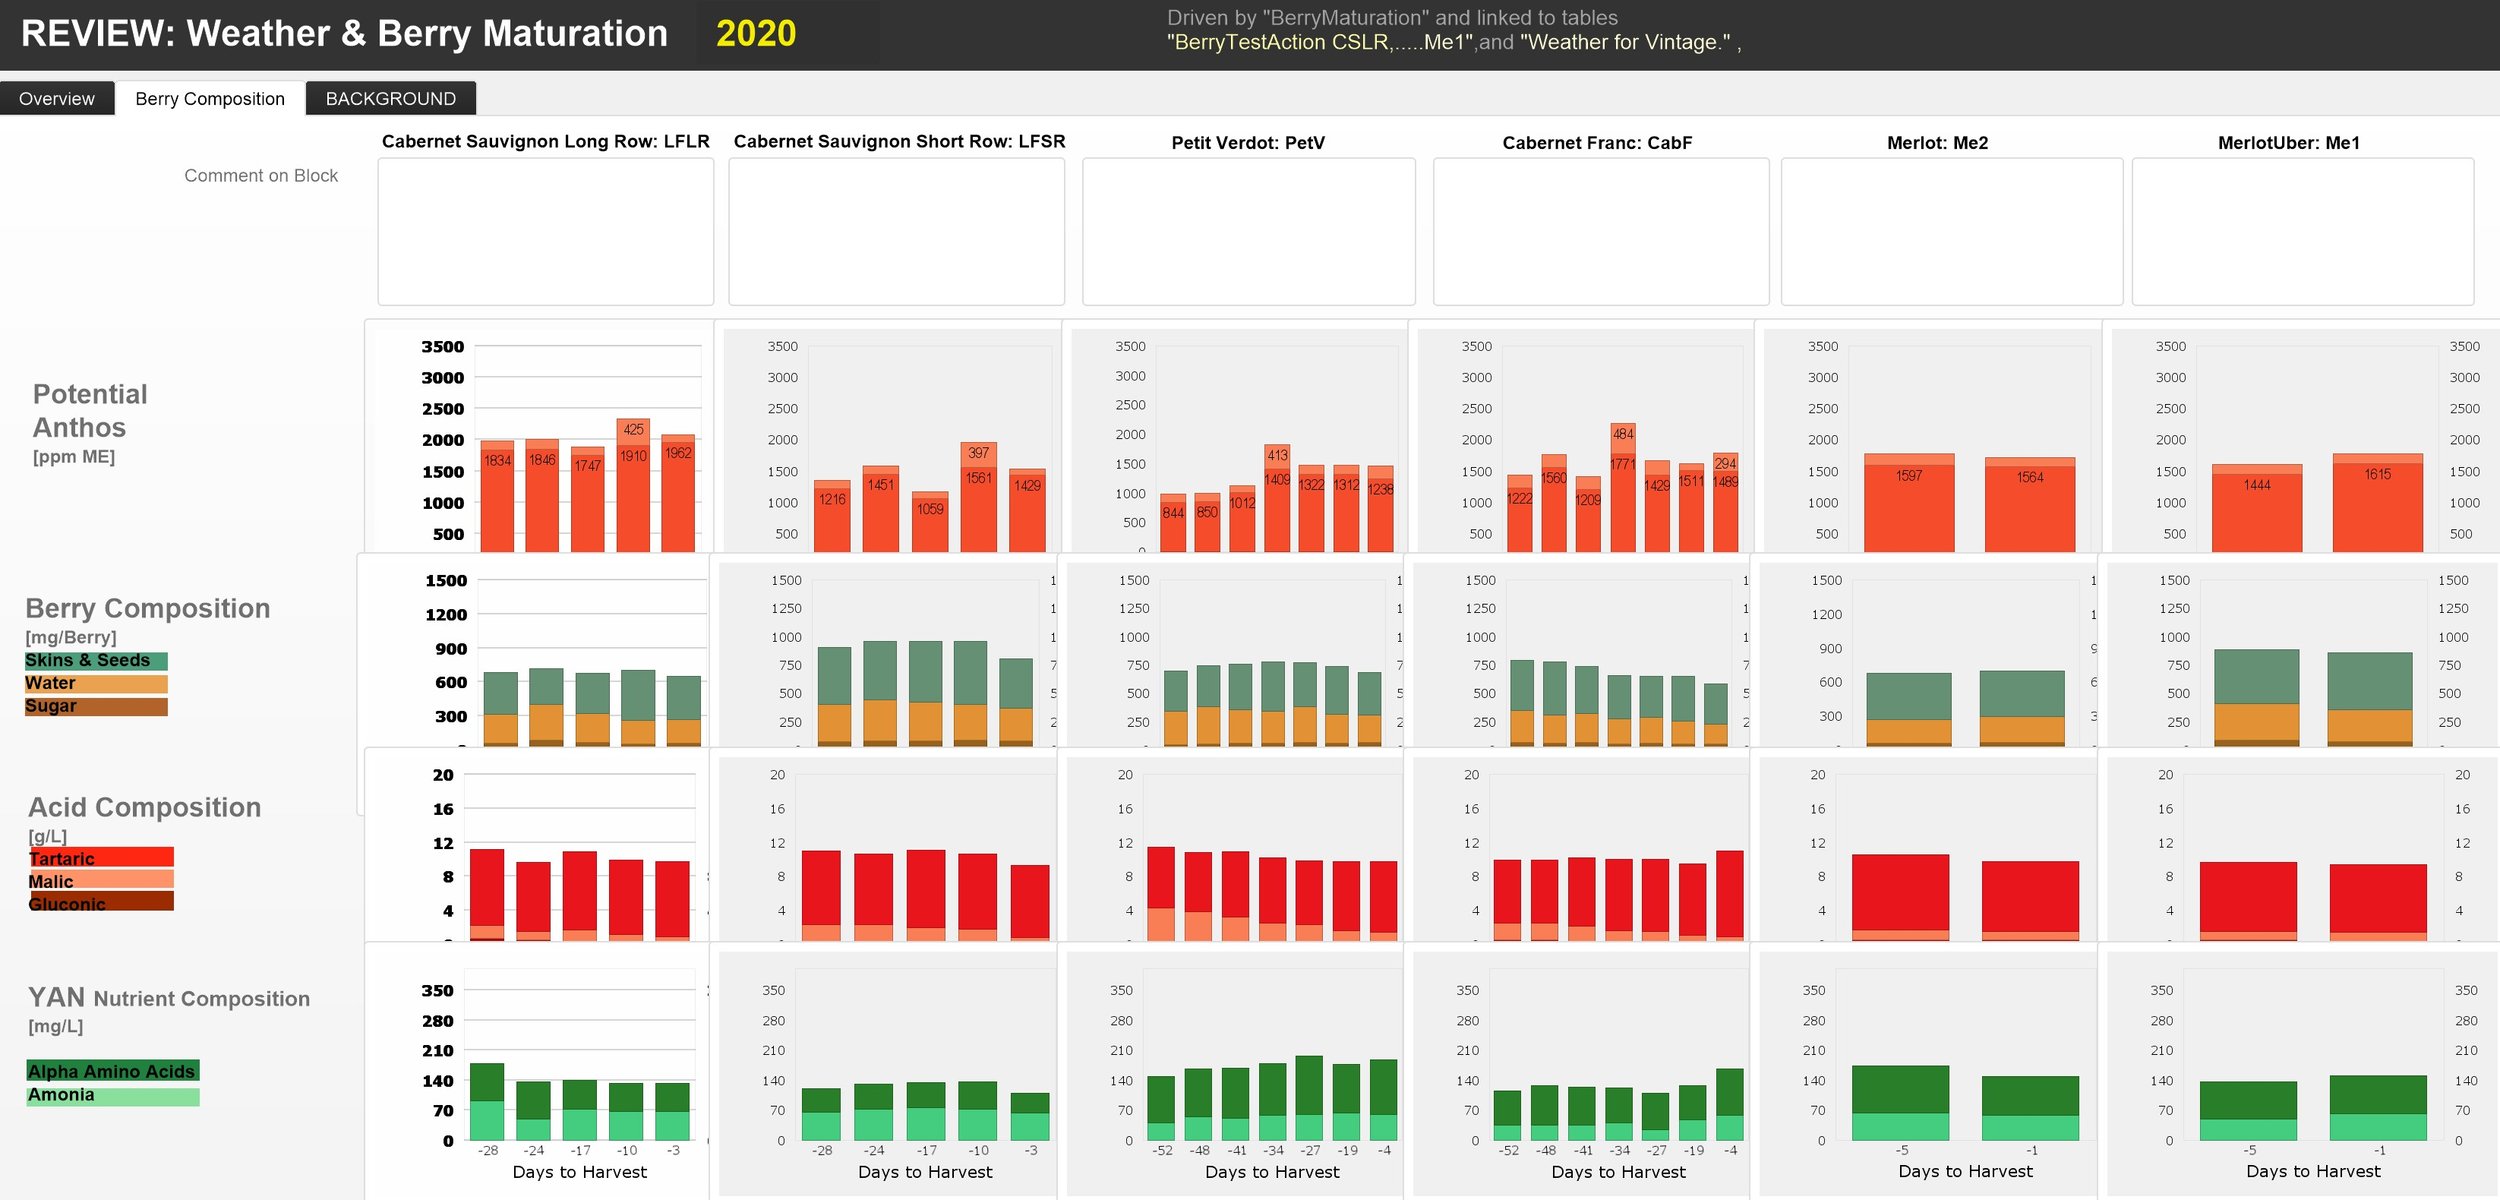
Note, the late maturation of the Petit Verdot block. The next screenshot shows the potentially extractable Anthocyanins, the berry composition and their size. Of note are the healthy Extractable Anthocyanin levels and the low YAN numbers, particularly in the lower field.
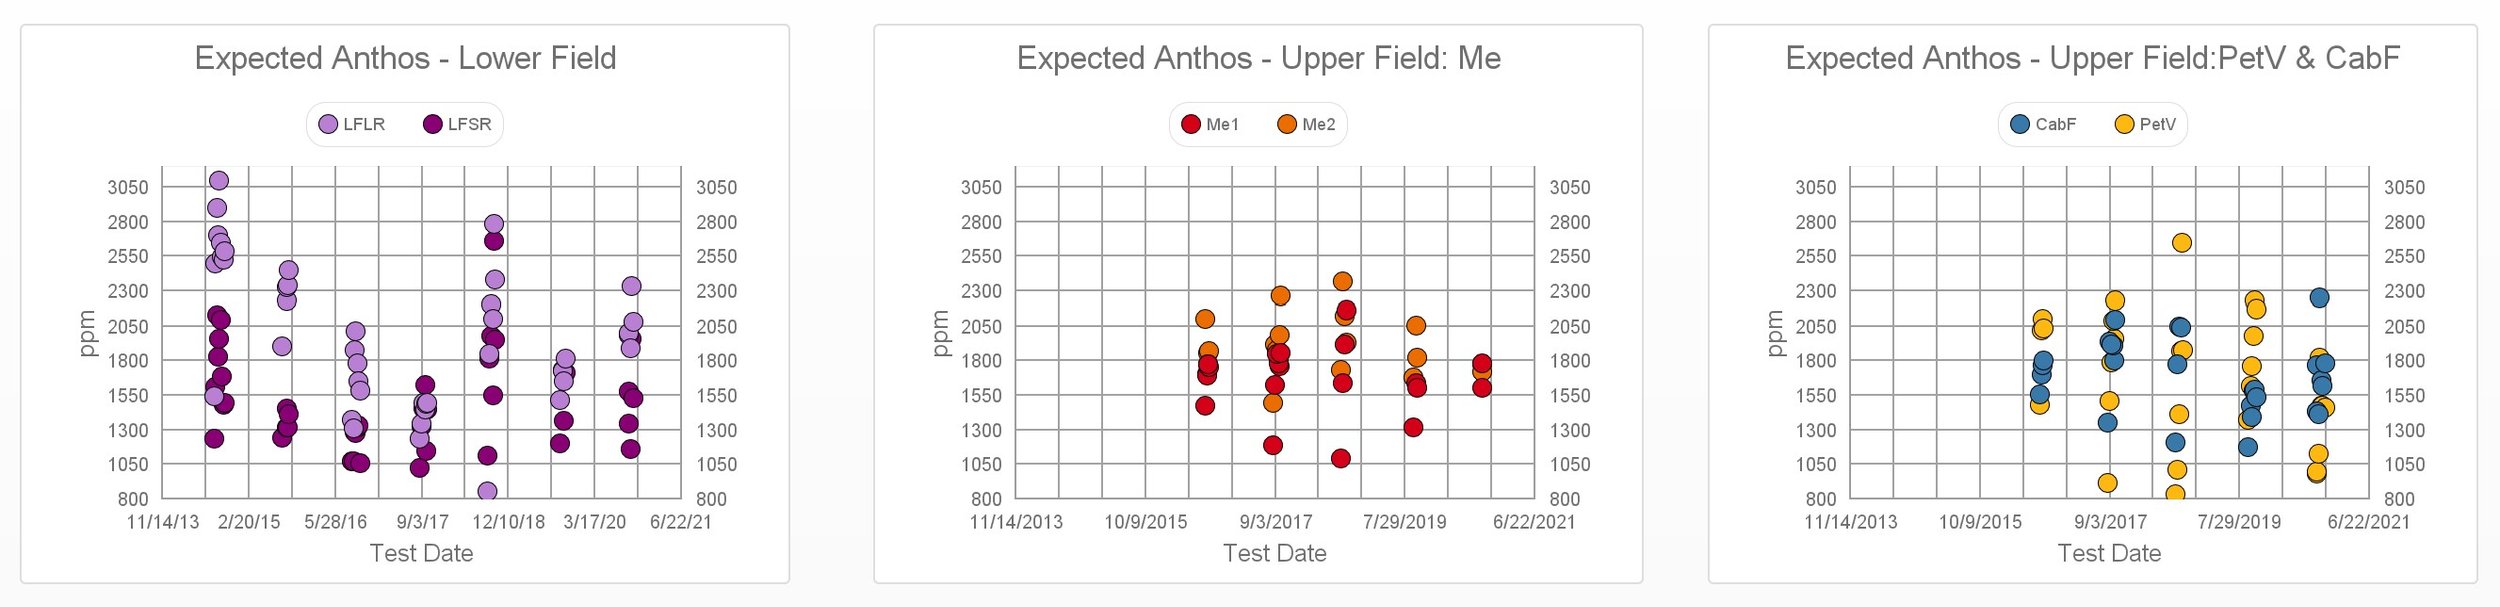
The following chart shows the Extractable Anthocyanin measurements over the last six years (four years for the upper field). Note how 2018 stands out with high Anthocyanin levels.
The layout “REVIEW: FieldLocations – Fruitload” shows how we estimated fruit loads and harvest volumes for 2020.

In summary, our Grape Maturity Assessment led us to:
Pick the Merlot blocks on September 17, with Potential Anthocyanins peaking around 1600. We estimated sugars around 21-22 Brix and pH relatively high in the 3.5-3.6 range. With an estimated 100% fruit load on Merlot Uber at 12 lbs/vine and Merlot at 7 lbs/vine, we estimated gross harvest yield at 480 and 450 lbs, respectively.
Pick the Lower Field on October 10 with Potential Anthocyanin levels having peaked one week earlier at a high 2000-2300 ppm. Three days before harvest, the sugar levels reached around 22 Brix, and the pH remained low at 3.3 – 3.4. YAN levels were low at 120 - 130. With an estimated 100% fruit load yield of 15-16 lbs/vine, we estimated gross harvest yield at 2100 and 1200 lbs for the long and the short rows, respectively.
Pick the Petit Verdot on November 3. Brix measured 21.8 and pH 3.7. We estimated 100% fruit load yield at 12 lbs/vine, resulting in an estimated gross harvest yield of 195 lbs.
The next page will show that some of these estimates were significantly off the mark: actual Brix and pH levels turned out almost 10% higher.
Previous page: Cleaning & Sanitation
Top of page: Go
Next Page: Step 2: Harvest & Sort
Last updated: November 30, 2021