Weather Monitoring
We monitor key weather variables (temperature, humidity, rainfall) in the vineyard for four purposes:
To estimate the anticipated picking date to plan and schedule the crew. We do this by tracking temperature in hourly intervals and calculating / graphing Growing Degree Days
To estimate the vulnerability of the vines to diseases, particularly mildew, to schedule spraying with fungicides. We do this by tracking a Mildew Pressure Indicator derived from temperature and humidity.
To evaluate the need for irrigation.
To provide an annual narrative for the weather to characterize the vintage.
We started collecting weather data consistently only in late 2012. For this, we use a Vantage Pro2 weather station from Davis (http://www.davisnet.com/weather/products/weather_product.asp?pnum=06152) to collect rain, temperature, and humidity data.
Growing Degree Days
Growing Degree Days (GDD) measures the heat plants have been exposed to over a season. The assumption is that grapes develop commensurate with the temperature multiplied by the time they are exposed to that temperature. The temperature needs to be above 55°F to start counting and not higher than 95°F. In simple terms, 1 GDD is accumulated when a plant is exposed to 58 °F for 8 hours (i.e., 58-55) * 1/3rd day). To calculate GDDs with reasonable accuracy, we need long histories of consistent hourly temperature readings and compute the sum of Growing Degree Hours divided by 24. Reliable data is available free at the National Oceanic & Atmospheric Administration (NOAA) ’s website http://www.nc°C.noaa.gov/. For temperature data, go to http://gis.nc°C.noaa.gov/map/viewer/#app=cdo&cfg=cdo&theme=temp&layers=1, select a location and download the data for the required time period.
Why then do we need our own weather station?
Long, high-quality time series of climate data is generally collected at airports only. We downloaded hourly data for the nearest airport (San Jose Airport, SJA) for 12 years and then computed the Cumulative GDDs. The graph on the left shows the result. The little red squares indicate the dates each year when we picked the grapes in the lower field. Note, at San Jose Airport, approx. 15 miles away, CGDDs reach somewhere between 2000 and 2400 by the time we pick at Chateau Hetsakais. If the San Jose Airport CGDDs measured ripeness accurately, all red squares should lie on a horizontal line theoretically. To look at this more closely, we computed the difference of each year’s CGDD curve with the average of all 12 years. The middle graph shows the result.
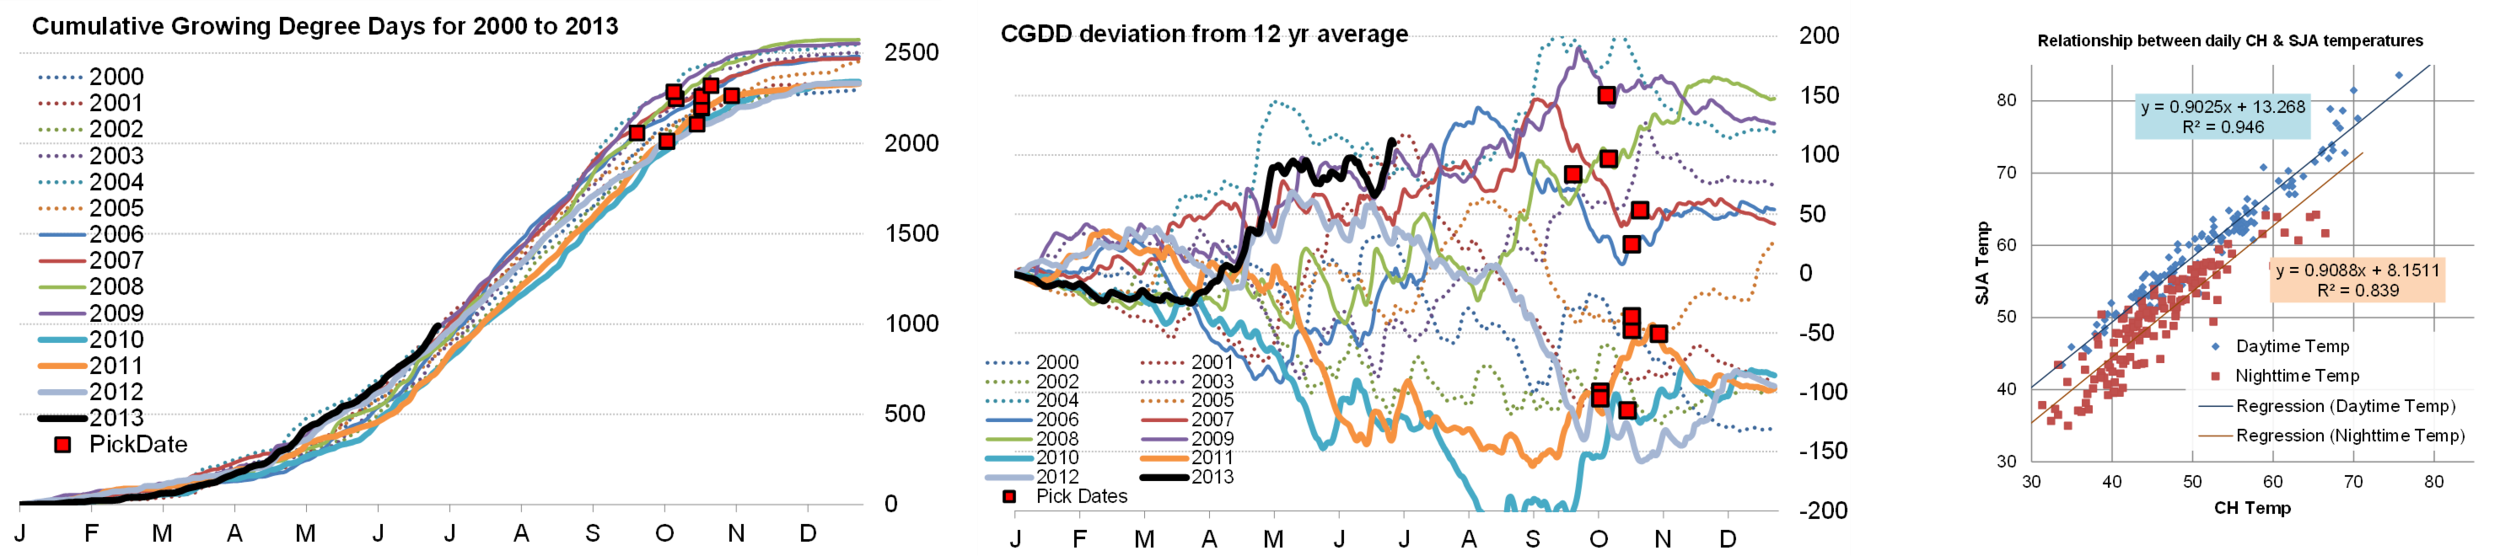
Again, the red squares should lie on a steeply sloping line because we would expect to have picked earlier in relatively warmer years and later in relatively cooler years. But it does not look like we did. There could be three different reasons for this “disconnect”: Either the GDD theory is not valid (I doubt it), or we did not pick at the same level of ripeness each year (possible), or the weather is different at S.J. Airport when compared to our vineyard (probable).
To test the latter, we checked the correlation of average daily daytime and nighttime temperatures between San Jose Airport and temperatures collected at our vineyard (only available for 2013. This graph on the right shows the result. The relationship is not very tight, with linear regressions showing R-Squares of less than 0.95. My conclusion is that we cannot rely on historical data collected at San Jose Airport. Instead, we need to collect our own data history. This is why we need our own weather station.
Data Management
We purchased a Vantage Pro2 weather station from Davis and collected our hourly weather data since mid-2012.
At this juncture, we only track and analyze the hourly temperature and humidity data. In the future, we plan to collect and analyze a broader range of data, including humidity, rainfall, U.V. intensity, etc. From the hourly data, we compute for every vintage in a spreadsheet:

Average temperature between 9am & 9 pm (day-time)
Average temperature between 9pm & 9am (night-time)
Average humidity between 9am & 9 pm (day-time)
Average humidity between 9pm & 9am (night-time)
Highest and Lowest temperatures for the day
Cumulative Growing Degree Days with 55dF and 95dF cutoff points
Average data for 2012 through the current year for every day of the year
7-day moving averages of all the above
Then we enter this data from the spreadsheet into the “WeatherData” table of the database. On the right is a screenshot of the day’s data for August 6, 2018. The following screenshot of the “Weather”-tab in the “REVIEW: Vintage”-Layout illustrates in the Weather tab how we use the weather data to summarize weather conditions for the 2020 vintage.

Previous page: Pest Management
Top of this page: Go
Next Page: Winery OVERVIEW
Last updated: May 7, 2021