Step #2: Harvest & Grape Sorting
This page covers the harvesting of grape bunches in the field, sorting out bad bunches and debris, destemming the bunches, and then sorting out remaining waste among the grape berries. The result is clean grape berries in the fermentation tanks.
Picking the Grapes
A manual harvest involves organizing a large enough picking crew to harvest all the grapes during the morning hours before it gets too hot. Exposing picked grapes to sunshine and heat for more than 1-2 hours can severely reduce their quality. We usually organize a group of a dozen or so friends to show up in the morning, hand them picking bins and clippers and get the job done within a few hours. The bribe is a good lunch.
In 2013 we started to record the crop volume [lbs] by row. In 2014 we estimated the crop load for each vine and then recorded the crop volume for each vine at harvest (except for low-yielding vines, which we combined into groups of 2, 3, 4, or 5 plants). In 2015 we recorded crop loads for each vine but in 2016 returned to recordings per row.
These charts show the harvest volumes over the last 20 years. We show the gross yield in the field for each block and how much ended up in the fermentation tanks. The y-axis in the charts is on a logarithmic scale to highlight the relative changes over time.

Three points of note:
We only started making wine in 2009, before we sold all our grapes.
The yield in the Cabernet Sauvignon blocks dropped significantly after 2009 because we battled a self-inflicted Eutypa infection of the vines. It took us almost ten years to recover from that mistake.
In 2016 the 4 blocks in the upper vineyard started producing Merlot, Cabernet Franc, and Petit Verdot.
Sorting, Destemming & Crush
Bunch sorting is a labor-intensive manual process taking as long as picking. We pour picking bins of grape bunches one by one on a table, and helpers sitting around the table sort out by hand all the irregular, infected or damaged bunches, and berries. Good bunches and grapes are passed on to destemming. Bad material is discarded. The percentage of the discarded material varies between 2% in a good year (e.g., 2014) and >25% in a bad year (e.g., 2011, 2015, 2017). We use three different setups for sorting and destemming, depending on volume:
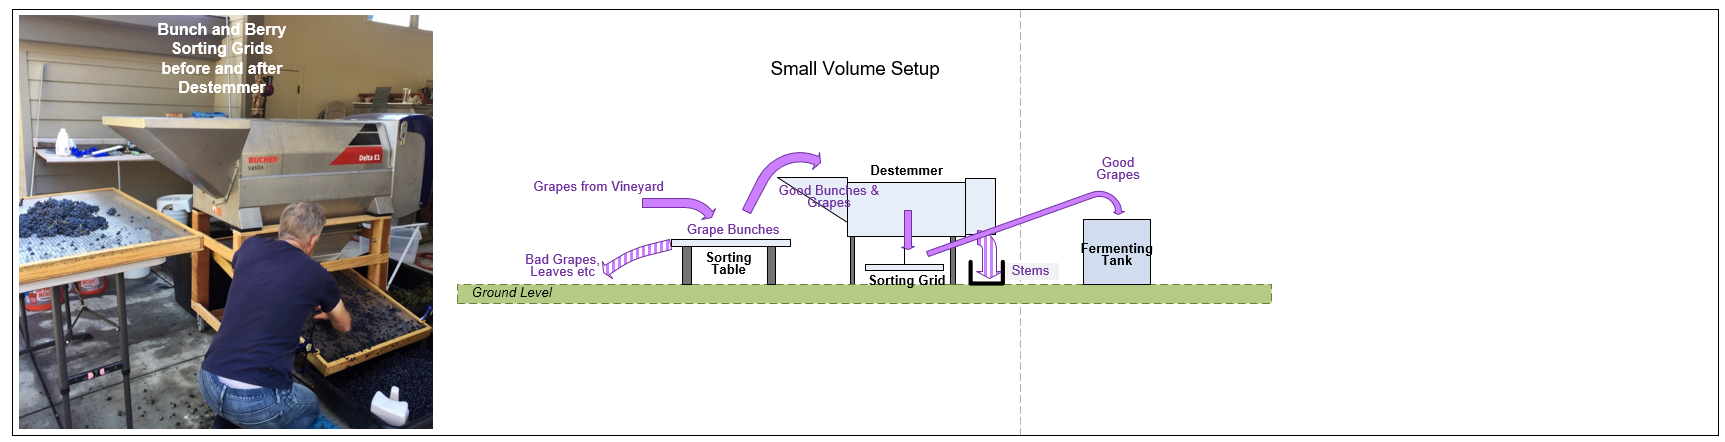
For small harvest volumes below 300 lbs, we use a single Bunch Sorting table from which we throw clean bunches into a Destemmer. The destemmer detaches the berries from the stems. The grape berries fall on a Berry Sorting grid from which we scoop the clean berries into a small fermentation tank. This is a two-person operation.We use a Delta E1 Destemmer from Bucher Vaslin (http://bvnorthamerica.com/wp-content/uploads/2013/07/Delta_E1_ang_avril_2007.p°F), which can efficiently process 1 ton of grapes per hour.
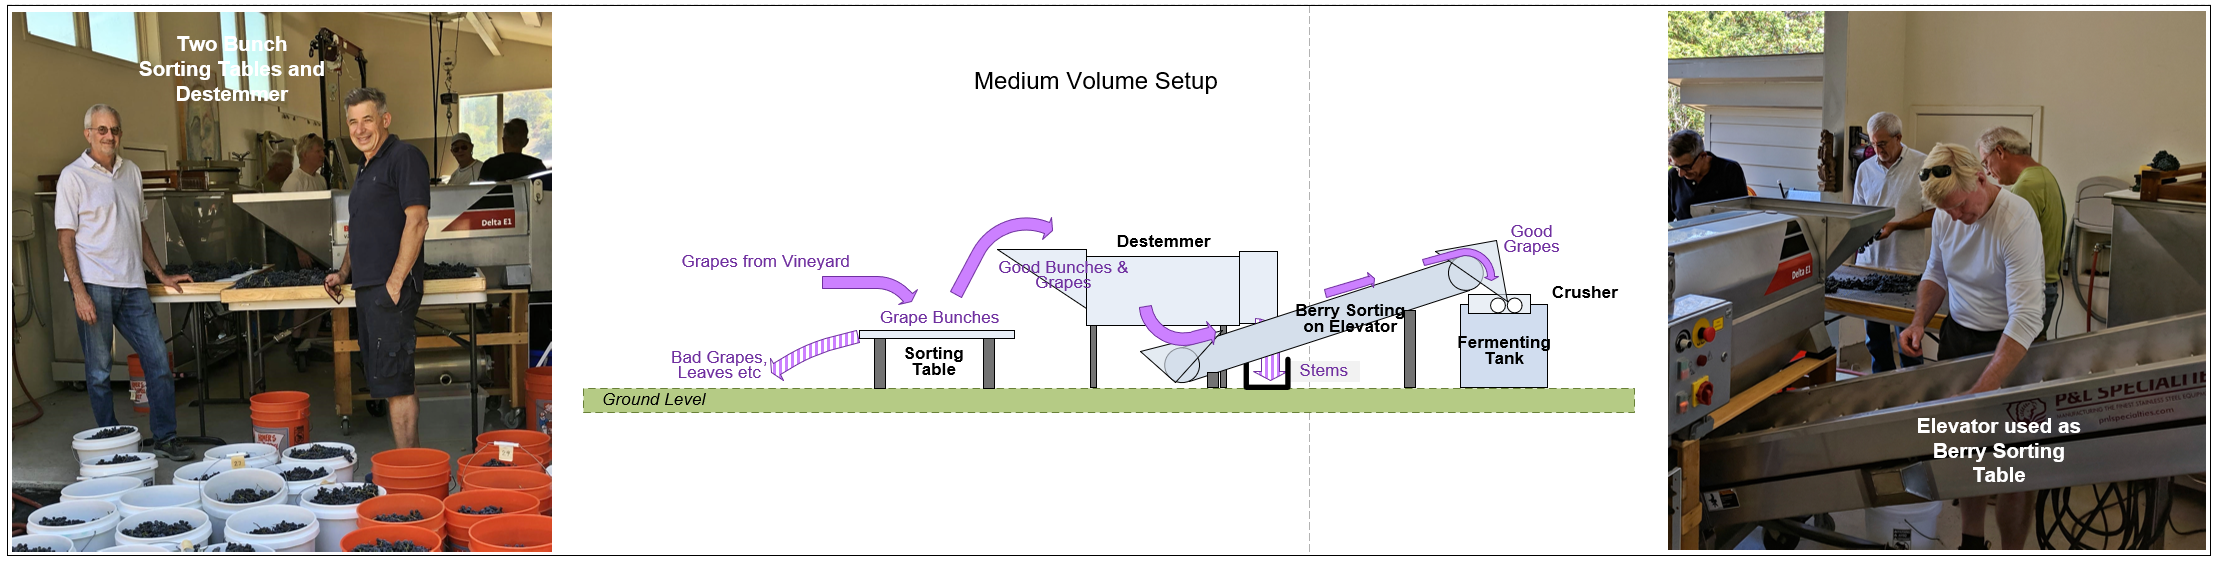

For medium-size harvests (300 – 1200 lbs), we add another bunch sorting table and a Grape Elevator, which we use as a platform for berry sorting. We may use a Crusher, which crushes the berries before they fall into the Fermentation Tank. The grape elevator was manufactured by P&L Specialties, Santa Rosa, CA ( pnlspecialties.com ). The Crusher is a modified electric grape crusher from Williams Brewing, San Leandro, CA ( williamsbrewing.com ). This is a 5-8 person operation.

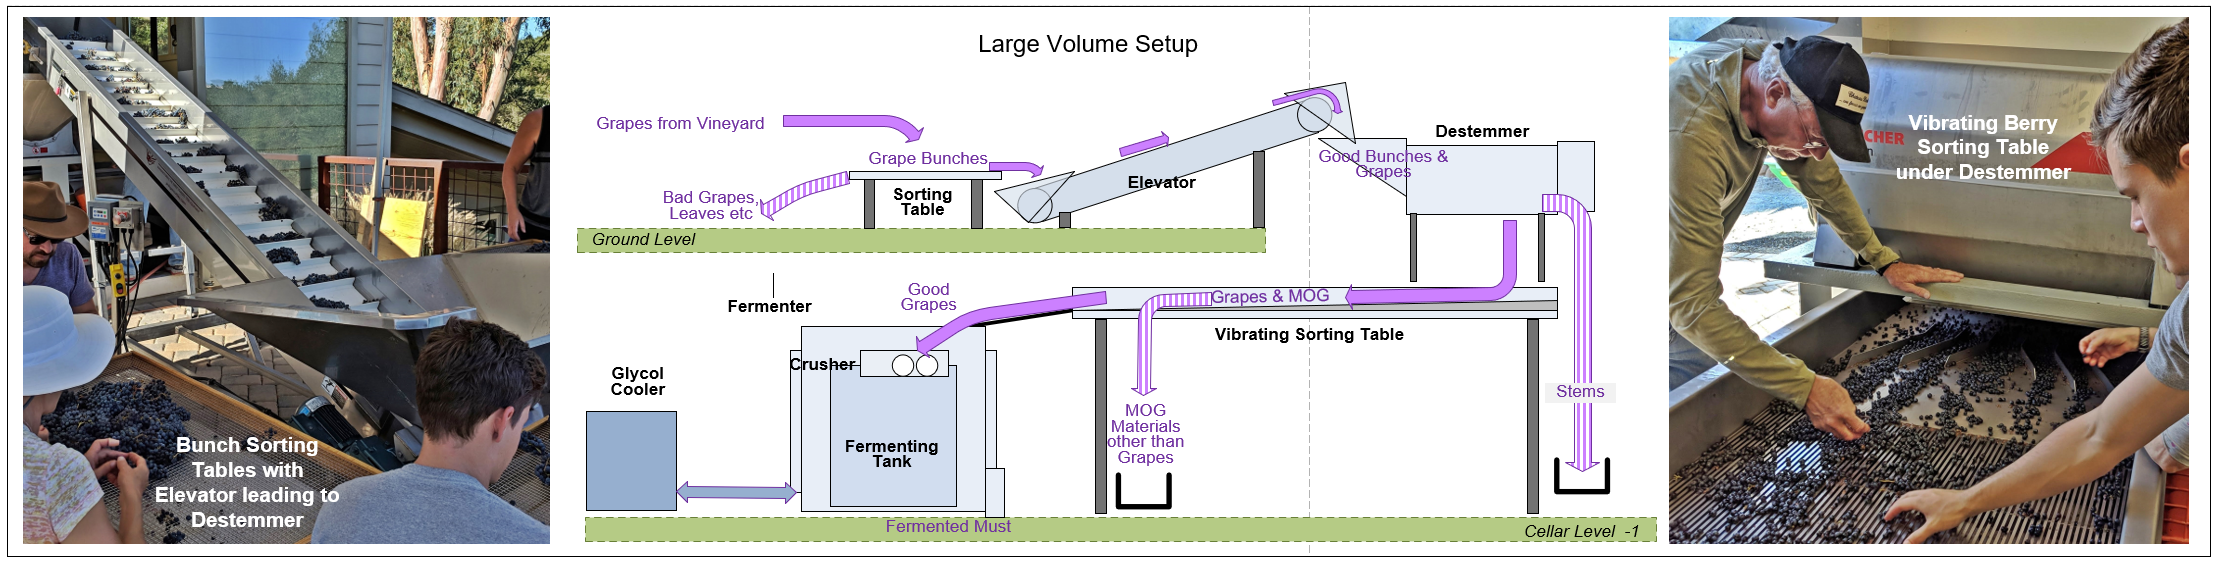
We add another bunch sorting table for larger harvests, and we mount the destemmer on top of a TRV15 Vibration Table from Bucher Vaslin (http://bvnorthamerica.com/wp-content/uploads/2013/07/TRV20-35-50_ANG_2006-11.p°F) on which we sort out bad berries and MOG (Material Other than Grapes). Under the sorting table, a pan collects juice from damaged grapes and MOG. That juice can be filtered and poured into the fermentation tank, or it can be counted as part of the “Saignee” and used elsewhere or discarded. At the end of the sorting table, a Grape Crusher can be inserted to break the grape skins before the gapes fall into the Fermentation Tank. This is an 8-12 person operation.
Data Management
We use the HarvestActions table is to record the weight of bunches collected with picking bins for each row or vine and the estimated percentage of weight left on the vine or dropped in the vineyard for each row. This screenshot shows how the weights were recorded by row for the 2018 harvest of the lower field (in 2018 we used 5-gallon buckets to collect grape bunches)

Next, we use the HarvestActions table record the sorting losses (bunch sorting, destemming, berry sorting, unused saignee from the vibration table) and how the net yield is allocated to different fermentation tanks. This screenshot shows the losses and allocations for the same harvest

This layout also summarises the grape quality as recorded in the berry tests. It provides an opportunity to record commentaries on the quality of each block and the harvest overall. It shows the labor input (in total manhours) accumulated to date for the must in each fermentation tank.
Tracking Results
The following screenshot provides details on the 2020 Harvests across all vineyard blocks, and all the way on the right margin, it summarizes volume-weighted average data across all blocks.

Note the following:
The estimated Anthocyanin levels averaged 1858 ppm, slightly below our target minimum of 2000 ppm. Thus the juice is expected to be somewhat weak in color and phenolic content.
The sugar levels measured in the field just before harvest averaged 22 Brix, significantly underestimating the average sugar levels measured in the tank: 23.58 Brix, slightly higher than our target of 23 Brix. We could have harvested a bit earlier.
The pH levels measured in the field averaged 3.44, close to our target of 3.5, but significantly underestimated the final pH in the tank averaging 3.79. We lost too much acidity in the grapes during the last weeks of maturation and should have harvested a week earlier on average.
The following two screenshots compare the 2020 harvest with all previous vintages. Note
The comparison of berry maturation across vintages confirms the observations above.
Net yields were high (total ~3700 lbs) despite relatively low average berry weights of less than 720 mg. We harvested more but smaller berries in 2020.
We lost more acidity in 2020 than in any other year. The average pH in the tanks, at 3.79, was higher than ever before.
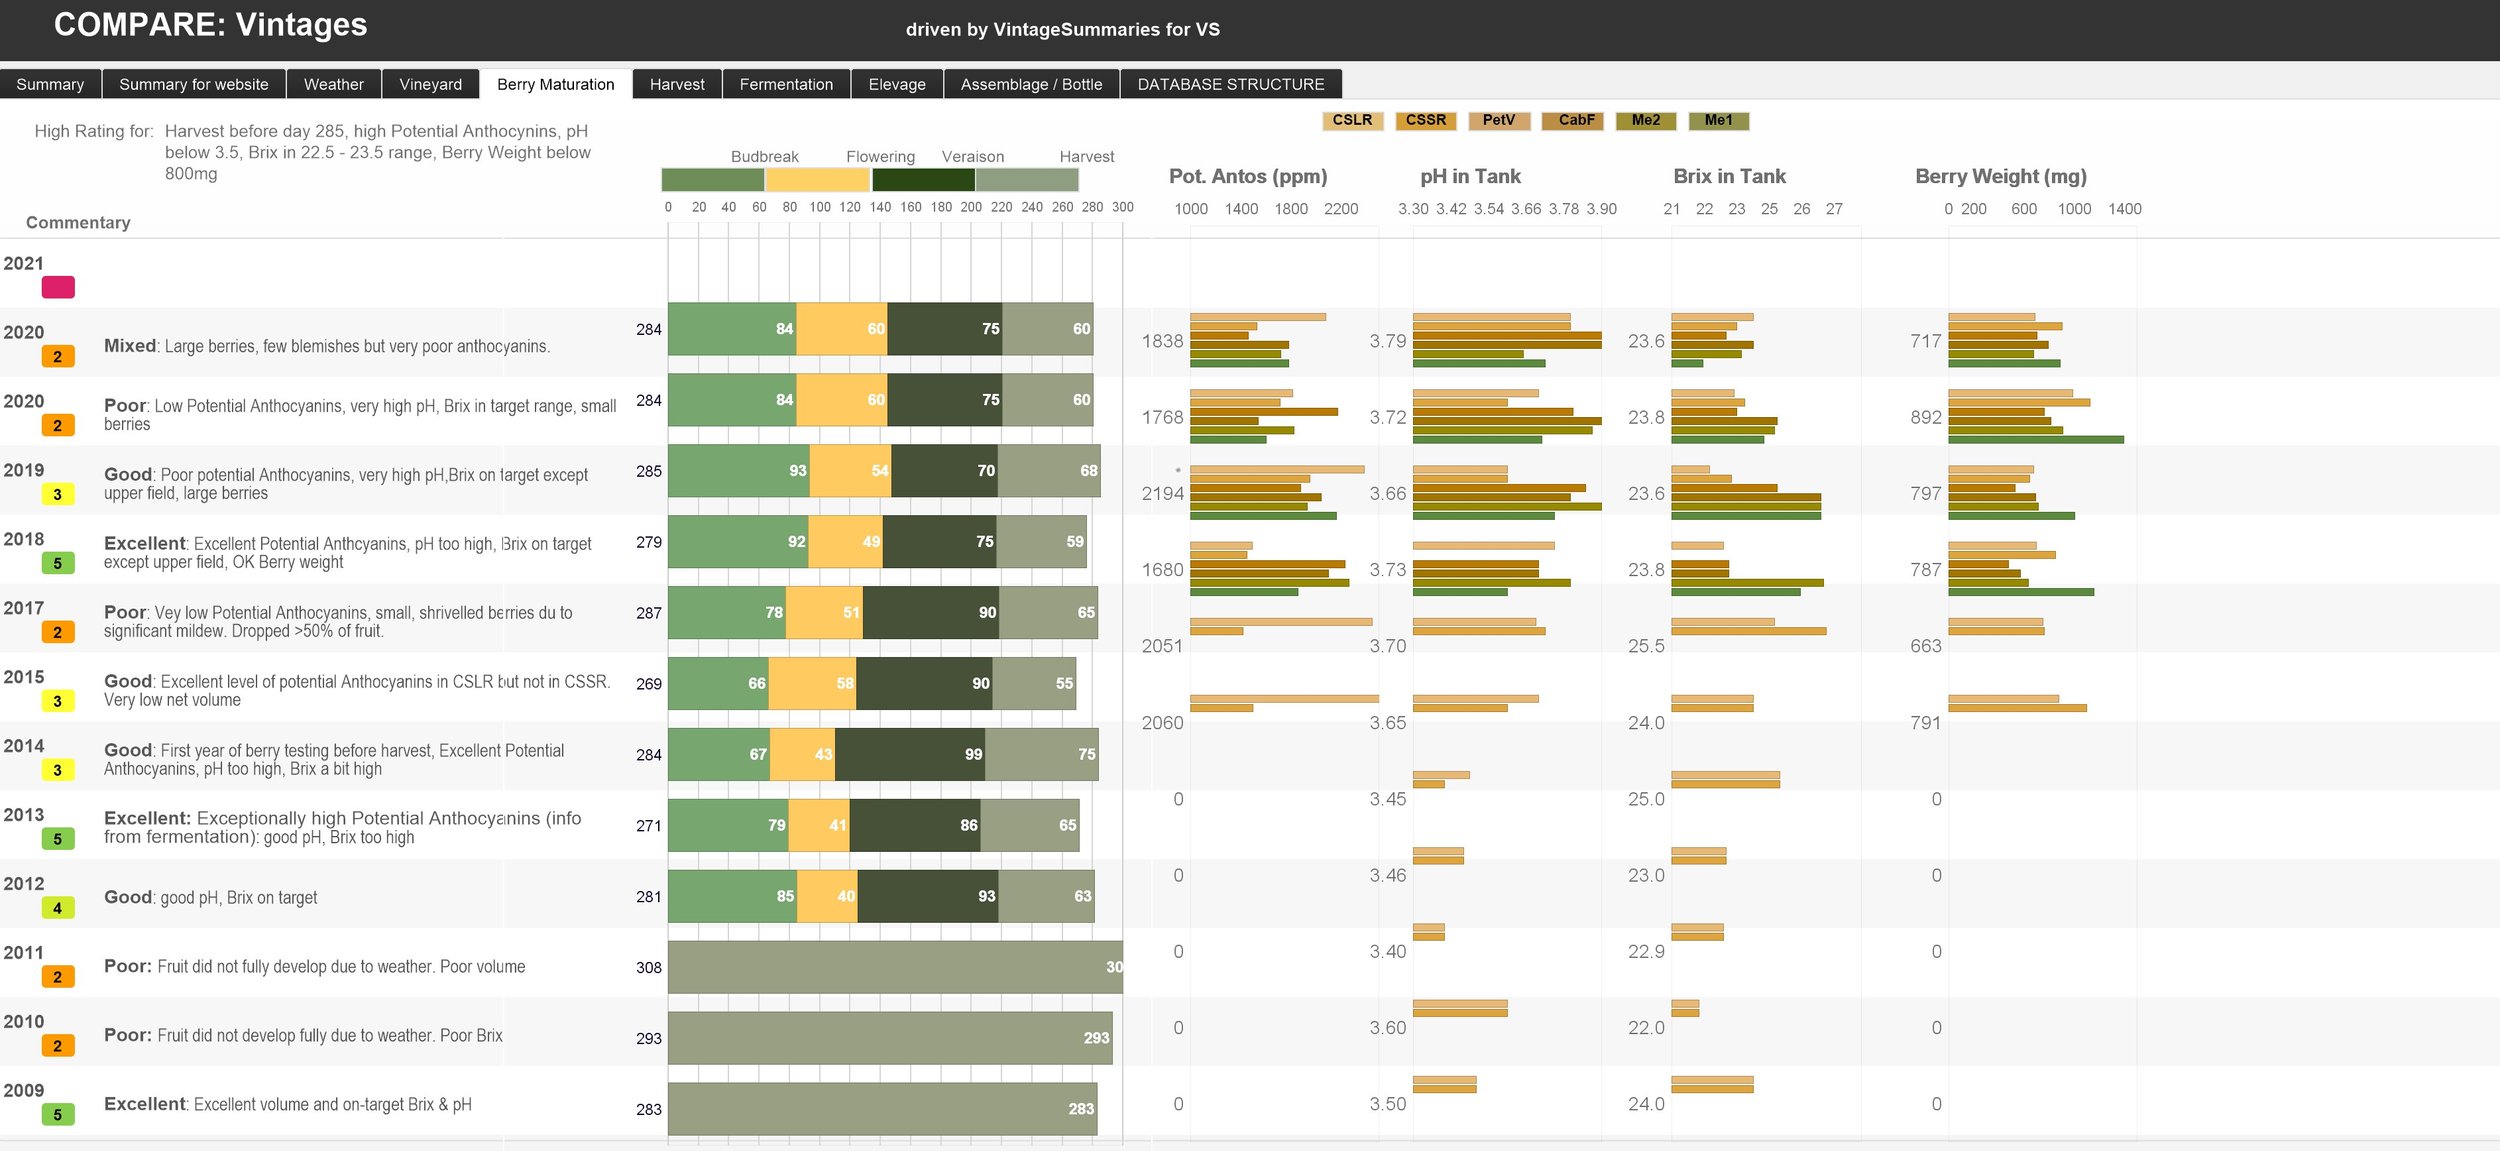
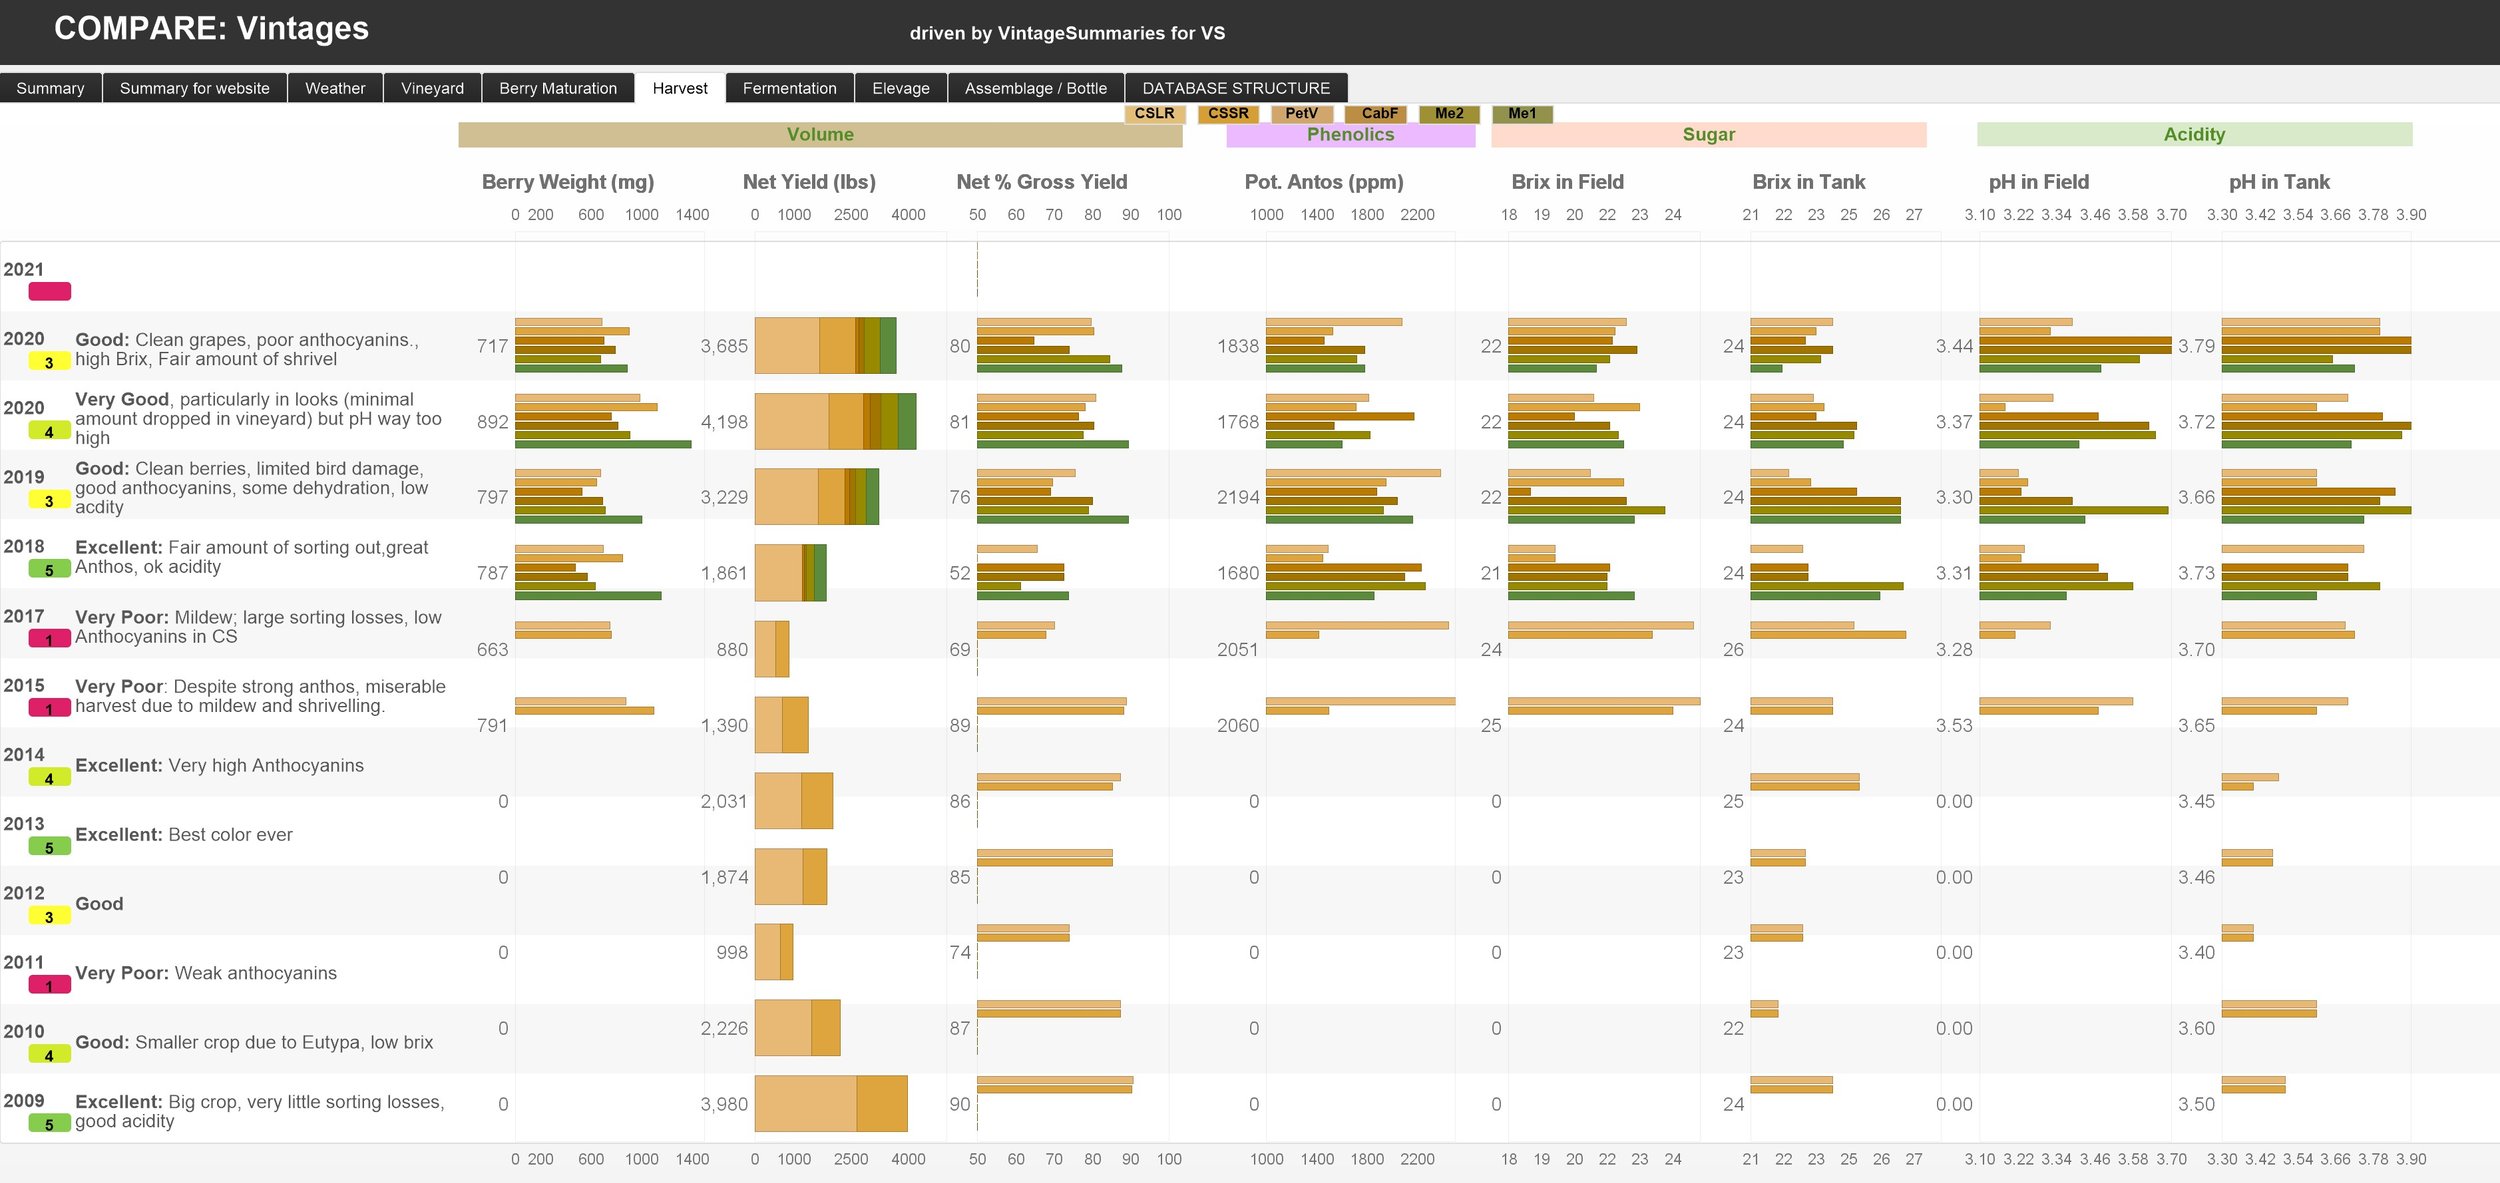
Clearly an average harvest at best.
Previous page: Assessing Grape Maturity
Top of page: Go
Next Page: Steps 3-11: Upfront Wine Making Decisions
Last updated:November 30, 2021