Measuring Phenolics in Wine
Phenolics are organic chemicals in grapes and wines responsible for their taste, mouthfeel, and color. There are thousands of different phenolic molecules, some small, others huge, some have simple organic structures, and others are very complex. They constantly interact with other chemicals and with each other as grapes grow, during fermentation into wine, and cellaring. These chemical processes are very complex and not yet fully understood.
The most important classes of phenolics in red wine are tannins and anthocyanins.
Anthocyanins are water-soluble pigments extracted from grape skins. They interact with themselves and provide color. Anthocyanins represent a family of different compounds. We measure their concentration in ppm of Malvidin equivalents (Malvadin is a simple type of Anthocyanin).
Tannins are also water-soluble but are extracted more slowly from the skin, seeds, and pulp. They impart an astringent character to the wine. We measure Tannin concentration in ppm of Catechin equivalents (Catechin is a simple type of Tannin).
Bound Anthocyanins result from the combination of Anthocyanins and Tannins. They are stable polymeric pigments and thereby provide color stability to the wine. The concentration of Bound Anthocyanins can be measured by absorbance at 520 nM.
Mature cabernet sauvignon grapes contain around 3.5 mg per grape of tannins – of these, approximately 58% are in the seeds, 38% in the grape skins, and 7 % in the flesh – all very different in structure and size. During fermentation, different proportions of these seed, skin, and flesh tannins get extracted and combined with anthocyanins (also present in the grapes). Later, these chemicals continue interacting with each other and the tannins and other chemicals in wine barrels. Typical Cabernet Sauvignon wine has around 700-1000 mg/L in tannins and 800-1100 mg/L in anthocyanins (concentrations are higher for Petit Syrah and lower for Merlot, Zinfandel and much lower for Pinot.
While we know very little about chemical processes, there is progress. In 2006 scientists at UC Davis, in cooperation with the Australian Wine Research Institute,, published papers describing how to measure, almost in real-time, the effect of different winemaking techniques on the extraction of tannins and anthocyanins. They measured the wine's absorption of ultraviolet light, correlatingd the results with phenolic compositions of similar wines analyzed using wet lab chemistry (the Harbertson-Adams Assay).Th. By 2012 the methodology evolved into two commercial applications: One is the Tannin Portal created by the Australian Wine Research Institute, which sells representative spectral data to analytic laboratories and large wineries so they can compare the spectra they measure locally (see https://www.awri.com.au/wp-content/uploads/tannin_portal_faq.pdf ). The other is a platform created by a commercial startup, WineXRay (see https://www.winexray.com ). Since then, many other commercial implementations have come to market.
WineXRay
Since 2013, we use the WineXRay platform developed by Gianni Colantuoni & Scott McLeod to estimate:

Free and Total Anthocyanins (basis of color and textural qualities)
Anthocyanins bound to tannins (basis of stable color and add textural qualities)
Protein-Precipitable Tannins (important for wine style and age-ability)
Total Iron-Reactive Phenolics: the amount of all phenolic compounds
This table shows typical levels for 2012 vintages of different grape varieties (extracted from a WineXRay presentation). Clearly, the typical phenolic and tannin levels vary significantly across grape varietals.
Laboratory Process
The measurement process we established requires the following equipment:
An Eppendorf 5424 Centrifuge to settle solids in the samples
A supply of 2mL test tubes for the centrifuge
A sipper system from Fisher Scientific (Model 72-310-080)
A Quartz Flow Cell 0.2mm from Starna Cell (Cat # 584.4-Q-0.2)
A Genesys 10S UV-Vis spectrometer from Fisher Scientific and
A laptop computer with VISIONLite software installed and a live link to the WineXray website
Here is an annotated picture:

The process itself consists of 4 steps
Step 1: Prepare samples.
Pour 2 mL of reference wine 2009 CSV CH into a test tube and label it R
Take the sample to be measured, strain it, pour 2 mL into a test tube, and label it S
Centrifuge both samples at 13,500 rpm for 5 minutes with the Eppendorf 5424 centrifuge
Decant both test tubes into new test tubes labeled the same: R and S
Step 2: Initialize the spectrometer.
Connect the laptop to the spectrophotometer, turn the spectrometer on, and launch the VISIONlite software in "Scan" mode using its associated shortcut.

Place the flow-through cell in the "B" position (Starna Quartz Flow Cell 0.2mm; cat. # 584.4-Q-0.2). Using the sipper Fisher Scientific Model 72-310-080, flush the flow-through cell with DI water for two to three minutes.
Click the "Baseline" button to zero the spectrophotometer readings.
Place the flow-through cell in the "1" position, and click the "Measure Sample" button.
A Sample Information window opens. Type in "yyyy-mm-dd baseline" and click "Measure." The Sample Information will open again on top of the VisionLite window; click Close.
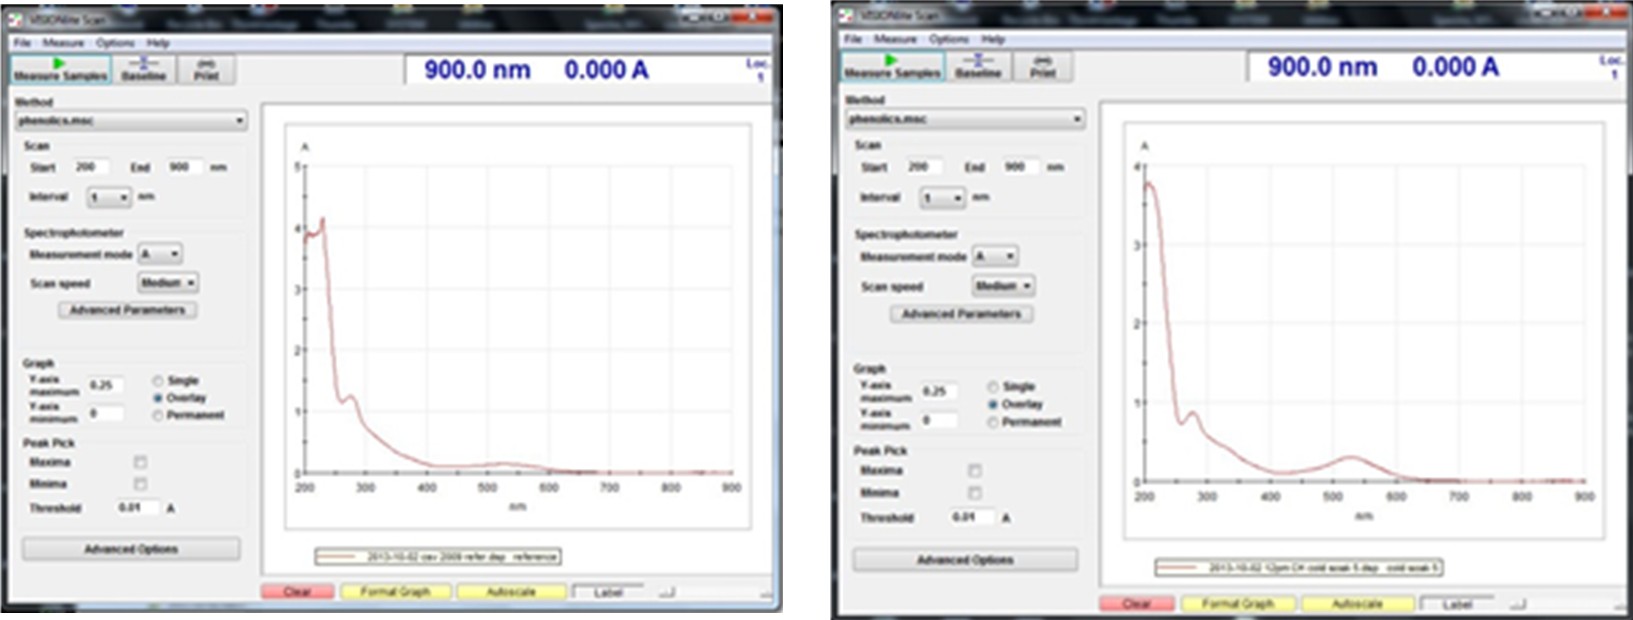
Click Autoscale under the spectrum graph. Assure that all the absorbance readings are less than 0.005 AU. The image shows a typical baseline spectrum. In case the absorbance readings are greater than 0.005 AU, flush the flow-through cell in the reverse direction using the cell-cleaning solution followed by DI water, and repeat the above steps

The system is now ready to measure the spectra of the wine samples.
Step 3: Measure the spectra. Do the following for each sample:

Use the sipper unit to prime the flow-through cell in position "1" in the spectrophotometer with the wine sample.
Click the "Measure Sample" button to run the spectrophotometer in scanning mode. A sample information screen comes up to fill in the sample name
Fill in "yyyy-mm-dd csv 2009 refer" if the sample is the reference wine; "yyy-mm-dd samplename" if the sample is the test sample. Then click the "Measure" button.
The spectrophotometer will now measure the sample’s absorbances at wavelengths from 200nm to 900nm. When complete, the Sample Information window will open on top of the VisionLite window; click “Close”, then click the “Autoscale” button to see the full spectrum. Examine for reasonableness.
Click File, then Save spectrum to save the spectrum data twice, first in dsp format, then in csv format in a folder on the laptop labeled with the date of the test sample.
Rinse the tubes and the Flow Cell using DI water for 30 seconds with the sipper.
Step 4: Upload the spectra and get phenolic results:
Open the wineXray website (http://www.winexray.com/Account/Login?ReturnUrl=%2fassay) and log in with your username and password. On the next screen, click on "SAMPLE UPLOAD."

Click "SELECT FILE" and point to the dsp spectrum file of the reference sample; then fill in the fields Crush Date, Vintage, Varietal, and Appellation and click the "REF?" button to get the checkmark.
Click another line of "SELECT FILE" and point to the dsp spectrum file of the test sample; then fill in the fields Crush Date, Vintage, Varietal, and Appellation.
You may add more spectral files at this point
Click the "REVIEW SPECTRA" button and inspect the graph for reasonableness
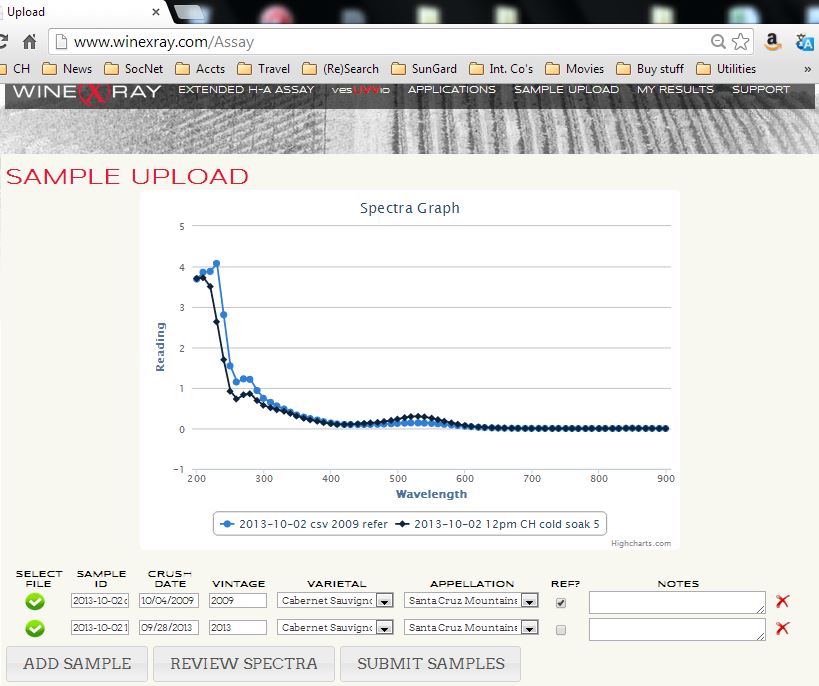
Click "Submit Samples," and you will get the phenolic profiles back within a minute. Save the results for future analysis.


Use Cases
One typical use of these measures is to monitor fermentations with daily sampling. The chart on the right (adapted from a WineXRay presentation) shows the extraction of tannins and anthocyanins into the juice. Because of the quick turn-around time (values can be estimated within 10 minutes of sampling), fermentations can be adapted on the fly. An example of using the Harbetson-Adams Assay at Francis Coppola Winery has been published in Vines & Wines, Oct 2010

A second use is to monitor the aging of wines in the cellar. The chart (adapted from a WineXRay presentation) shows the level of anthocyanins over four years.
For the original research presented on this subject, read https://www.ajevonline.org/content/58/3/318
Review of first results on our wines
The following screenshot shows the phenolic data saved in our database for one of three 2013 fermentation batches. We measure phenolics every day. Note that this was a long fermentation that was not fully complete (0.5 Brix at the end). Note also some measurements had to be "manually" adjusted for obvious measurement errors.


The screenshot on the right shows the phenolic data for the entire life of the 2013 vintage: From fermentation through elevage and bottle maturation. Note we did not yet collect phenolic data in the vineyard in 2013. We started that only in 2014 – this is covered in the following section (measuring phenolics in grapes)

The last screenshot on the right shows all the phenolic measurements for all the vintages to date (2009) – 2022) during elevage. Note the ranges' differences each year, primarily due to weather patterns during the respective growing seasons.
Previous page: OenoFoss for basics
Top of page: Go
Next Page: Enotrex for measuring Phenolics in Grapes
Last updated: March 2, 2023