Tables for Winemaking Data
This page describes the tables used primarily to capture data in Winery activities. They are:
- BerryTestAction: Holds descriptions of how we test berries during their final weeks of maturation so we can decide when to harvest.
- BerryMaturation: Holds the critical dates of berry maturation and when we test it; and it contains observations on weather and berry quality.
- Vessels: Holds descriptions of the containers we use to ferment the juice and mature the wine (tanks, barrels, bins, carboys etc.)
- HarvestActions: Holds descriptions of how we track harvest volumes for each Vintage and Block, whether we buy or sell grapes, how we sort out bad bunches, defect berries, other debris and stems, and how we allocate the resulting must to different Fermentation Batches
- FermBatchDefinitions: Holds descriptions of and describes Fermentation Batches. We define Fermentation Batches during harvest as we decide how to allocate different types and amounts of berries to different fermentation vessels. We describe Fermentation Batches after the fermentation has completed and we can review the process and results.
- FermentationActions: Holds descriptions of how we manage each Fermentation Batch. The actions include daily punchdowns, enzyme, yeast and nutrition additions, pressing etc.
The following paragraphs describe each table
BerryTestAction
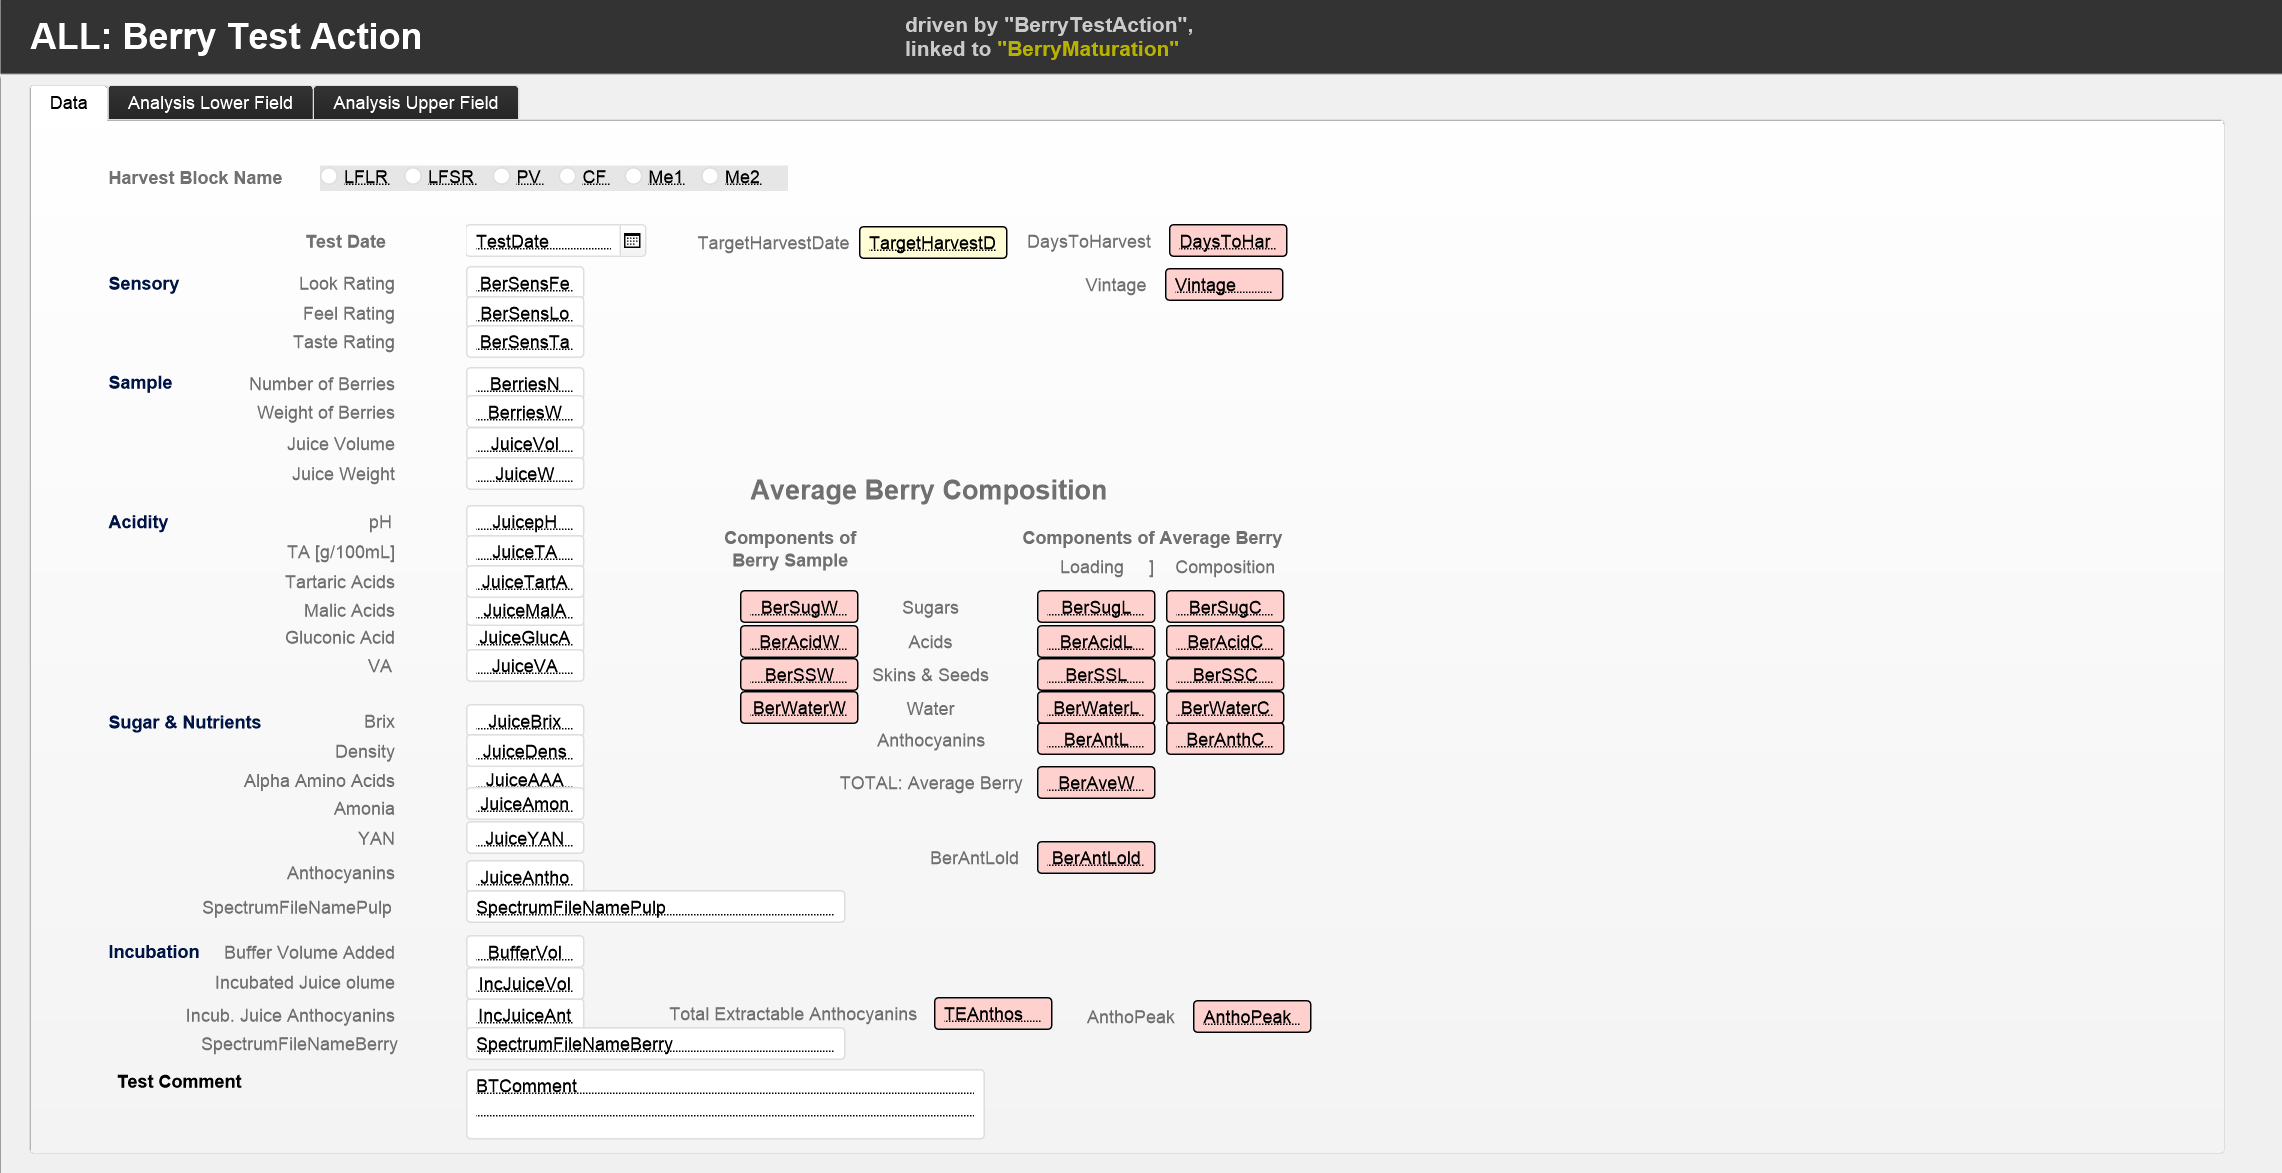
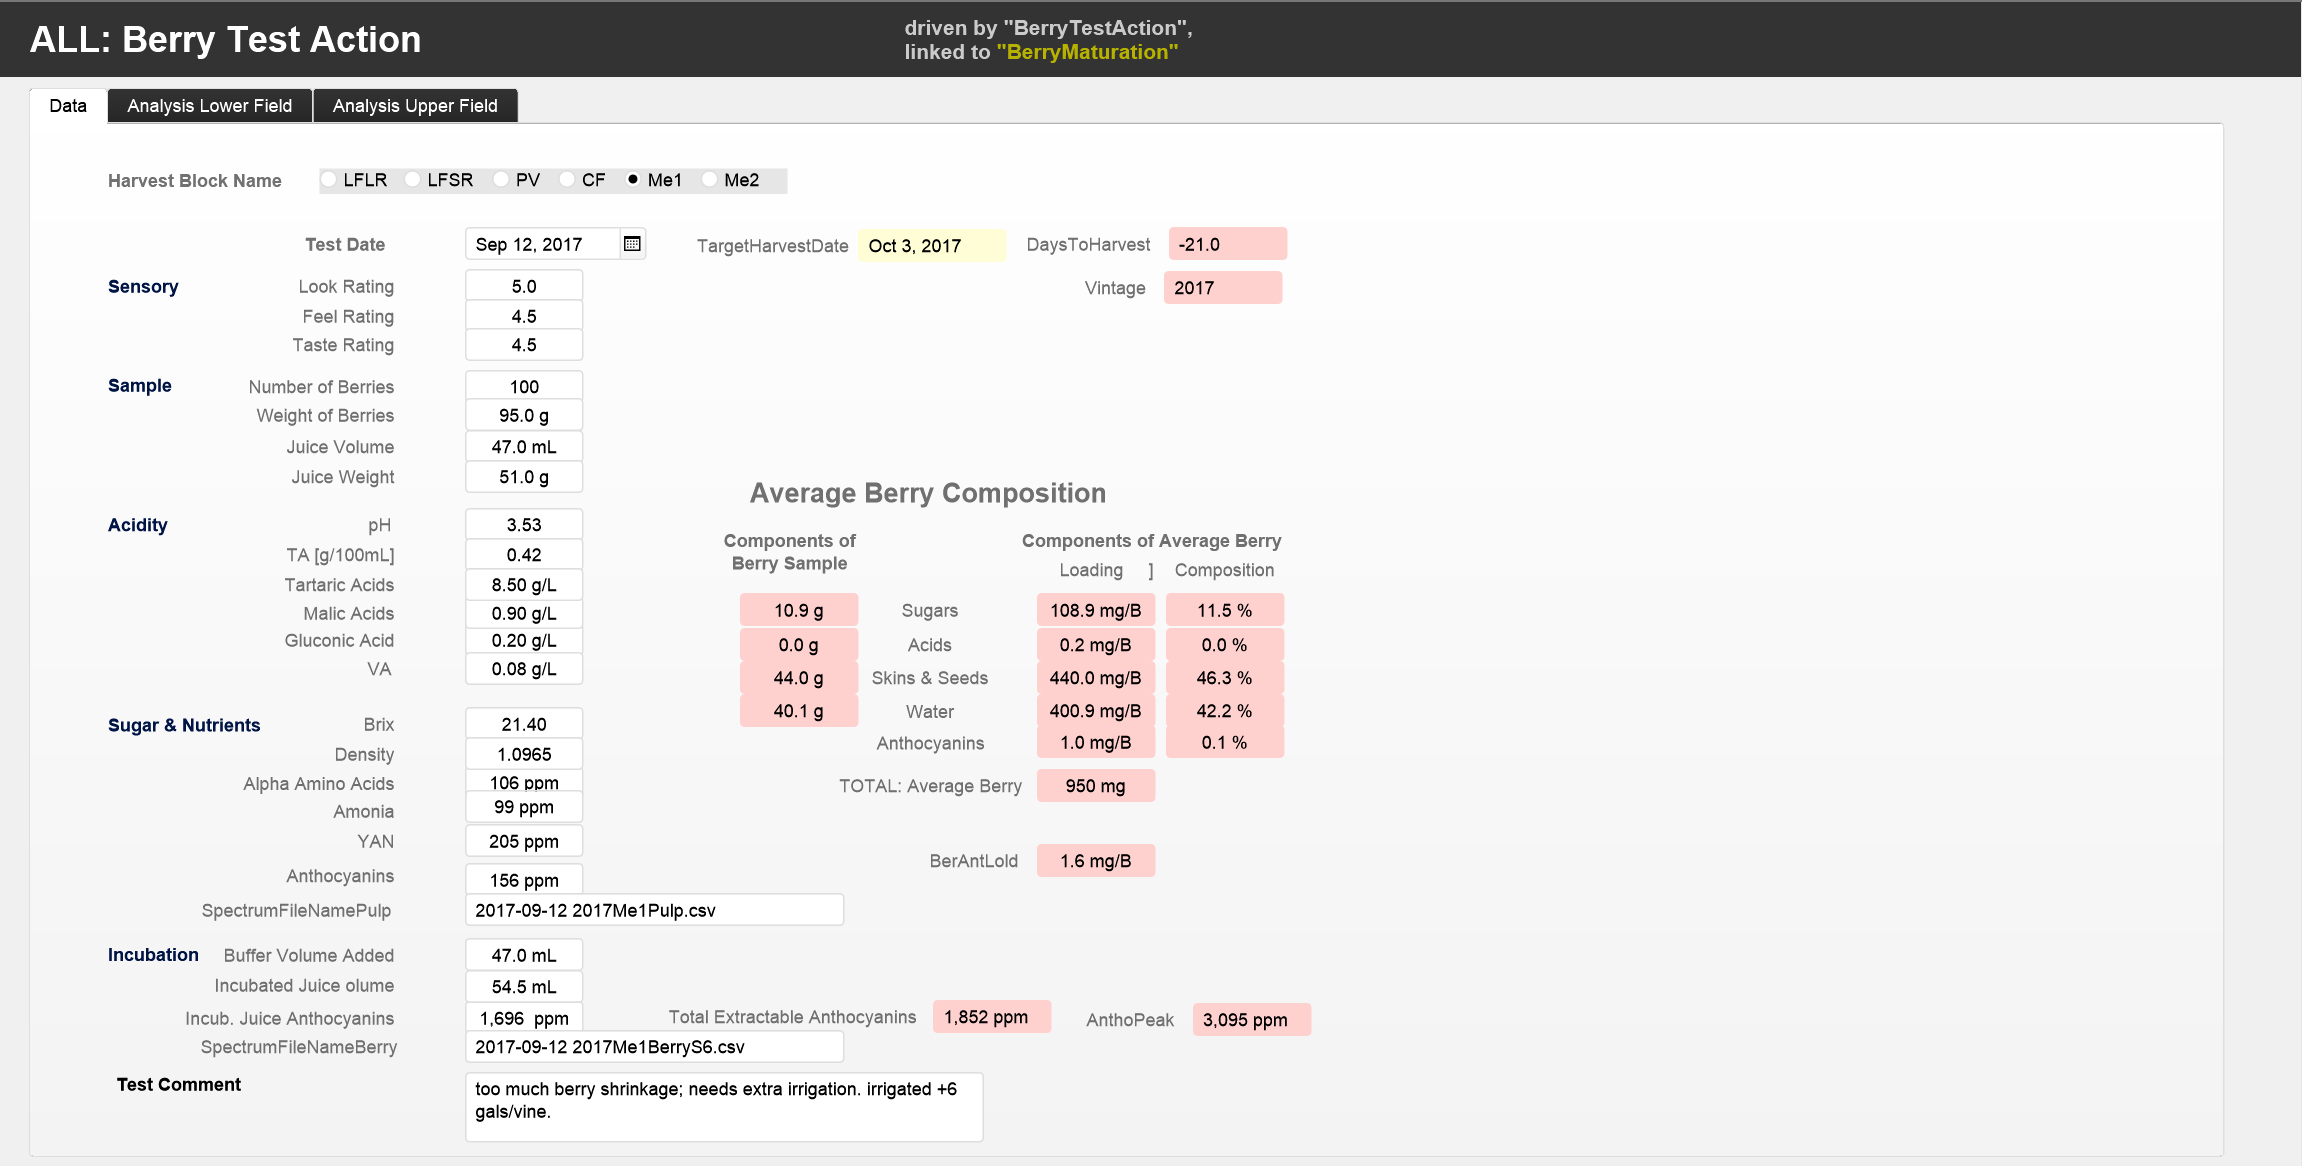
This table holds the data describing a Berry Test on a given date in a given vineyard block. The table tracks the results from testing berries before harvest to decide when to pick. It contains information on a) sample description, b) sensory judgement on physiological ripeness, c) chemical juice analysis and d) berry composition and phenolic potential
a) Sample Description
- HBName: Name of harvest block (from Value List VHBName, currently set at “LFLR, LFSR, PV, CF, Me1, Me2”)
- TestDate: Date when berry test was taken
- Target Harvest Date: expected date of harvest; taken from HarvestDates table as =
- If ( HBName="LFLR"; HarvestDates::HDCabSauvLR;
- If ( HBName="LFSR"; HarvestDates::HDCabSauvSR;
- If ( HBName="CF"; HarvestDates::HDateCabFranc;
- If ( HBName="PV";HarvestDates::HDPetitVerdot;
- If ( HBName="Me1";HarvestDates::HDMerlotUber;
- If ( HBName="Me2"; HarvestDates::HDMerlot )))) ))
- DaysToHarvest = TestDate – TargetHarvestDate [days], expected number of days to harvest.
- Vintage: Vintage year (calculated from TestDate since the harvest is always in the same year as the respective berry test)
- BerriesN: Number of berries in the test sample (usually 100)
- BerriesW: Weight of test sample measured in grams (e.g. 102 g)
b) Sensory judgement on physiological ripeness
- BerSensLook: rating between 1 and 4 on the skin and seed colour ripeness
- BerSensFeel: rating between 1 (hard) & 4 (soft) on berry ripeness
- BerSensTaste: rating between 1 & 4 (acidity, sweetness, astringency and tannin intensity) on skin and pulp taste
c) Chemical juice analysis
- JuiceVol: Volume of juice extracted from the test sample in standardised press measured in millilitres (e.g. 55 mL)
- JuiceW: Weight of juice extracted from the test sample measured in grams (e.g. 55 g)
- JuiceBrix: Sugar content of extracted juice measured in gram sucrose per 100mL, i.e. Brix (e.g. 24.5)
- JuiceDens: Juice Density [g/mL]
- JuiceAAA: Alpha Amino Acid concentration in juice [mg/L]
- JuiceAmon: Ammonium concentration in juice [mg/L]
- JuiceYAN: Yeast Assimilable Nitrogen concentration [mg/L]
- JuiceAnthos: Anthocyanin concentration in extracted juice measured [ppm Malvadin Equivalent] (e.g. 170 ppm)
- JuicepH: pH of juice extracted from the test sample
- JuiceTA: Total Acidity of juice [mg/L]
- JuiceVA: Volatile Acidity in juice [mg/L]
- JuiceGlucA: Gluconic Acids in juice [mg/L]
- JuiceTartA: Tartaric Acids in juice [mg/L]
- JuiceMalA: Malic Acids ice [mg/L]
d) Berry composition and phenolic potential
- BufferVol: Volume of buffer solution added to pressed seeds & skins [mL]; usually = JuiceVol.
- IncJuiceVol: Volume of juice pressed from incubated sample (i.e. pressed “seeds & skins + buffer” after 2 hrs at 55 dC incubation)
- IncJuiceAnthos: Anthocyanin concentration in incubated juice measured [ppm Malvadin Equivalent] (e.g. 170 ppm)
- TEAnthos = IncJuiceAnthos + JuiceAnthos: Total Extractable Anthocyanins [mg/L ME]
- BerAcidW = JuiceTA * JuiceVol / 1000 [g]: weight of acids in sample
- BerSSW = BerriesW - JuiceW [mg]: Skins & Seeds weight in sample
- BerSugW = JuiceBrix * JuiceW / 100 – BerAcidW [g]: Sugar weight in sample
- BerWaterW = BerriesW - BerSSW - BerAcidW – BerSugW [g]: Water weight in sample
- BerSugL = BerSugW * 1000 / BerriesN: Berries Sugar Loading [mg/B], weight of sugar in average berry.
- BerAcidL = BerAcidW * 1000 / BerriesN [mg/B]: Berry Acids Loading; weight of Acids in average berry
- BerWaterL = BerWaterW * 1000 / BerriesN [mg/B]: Berry Water Loading; weight of water in average berry
- BerSSL = BerSSW * 1000 / BerriesN [mg/B]: BerrySkins & Seeds Loading; weight of skins & seeds in average berry
- BerAntL = TEAnthos / 1000 * IncJuiceVol / BerriesN: Berry Anthocyanins Loading; weight of Anthocyanins in average berry
- BerAveW = BerriesW / BerriesN * 1000 [mg] Weight of average berry.
- BerSugC = BerSugL / BerAveW * 100 [%] Berries Sugar Content ; share of sugar in average berry weight.
- BerAcidC = BerAcidL / BerAveW * 100 [%] Berries Acid Content; share of acids in averager berry weight.
- BerWaterC = BerWaterL / BerAveW * 100[%] Berries Water Content; share of water in average berry weight.
- BerSSC = BerSSL / BerAveW * 100 [%] Berries Skins & Seeds Content; share of skins & seeds in average berry weight.
- BerAntC = BerAntL / BerAveW * 100 [%] Berries Anthocyanins Content; share of anthocyanins in average berry weight.
- AnthoPeak = Max ( TEAnthos) when records are sorted by HarvestBlock and Vintage
- BTComment: Text field containing commentary to berry sample
The screenshots show the layout with field names and the data from the Berry Test on September 12, 2017, in the Me1 block. The white fields represent data we record for each test (e.g. Number of Berries collected, pH etc.). The pink fields show data we derived from the input (e.g. Average Berry Weight). The pale yellow field shows related data in a connected table which is required to calculate data in this table (e.g. Target Harvest Date comes from the BerryMaturation table and is needed to calculate DaysToHarvest, how many days remain until Harvest.

This graphic shows how the BerryTestAction table is linked to the BerryMaturation table (disregard the linkages to the Weather table for this purpose)
BerryMaturation
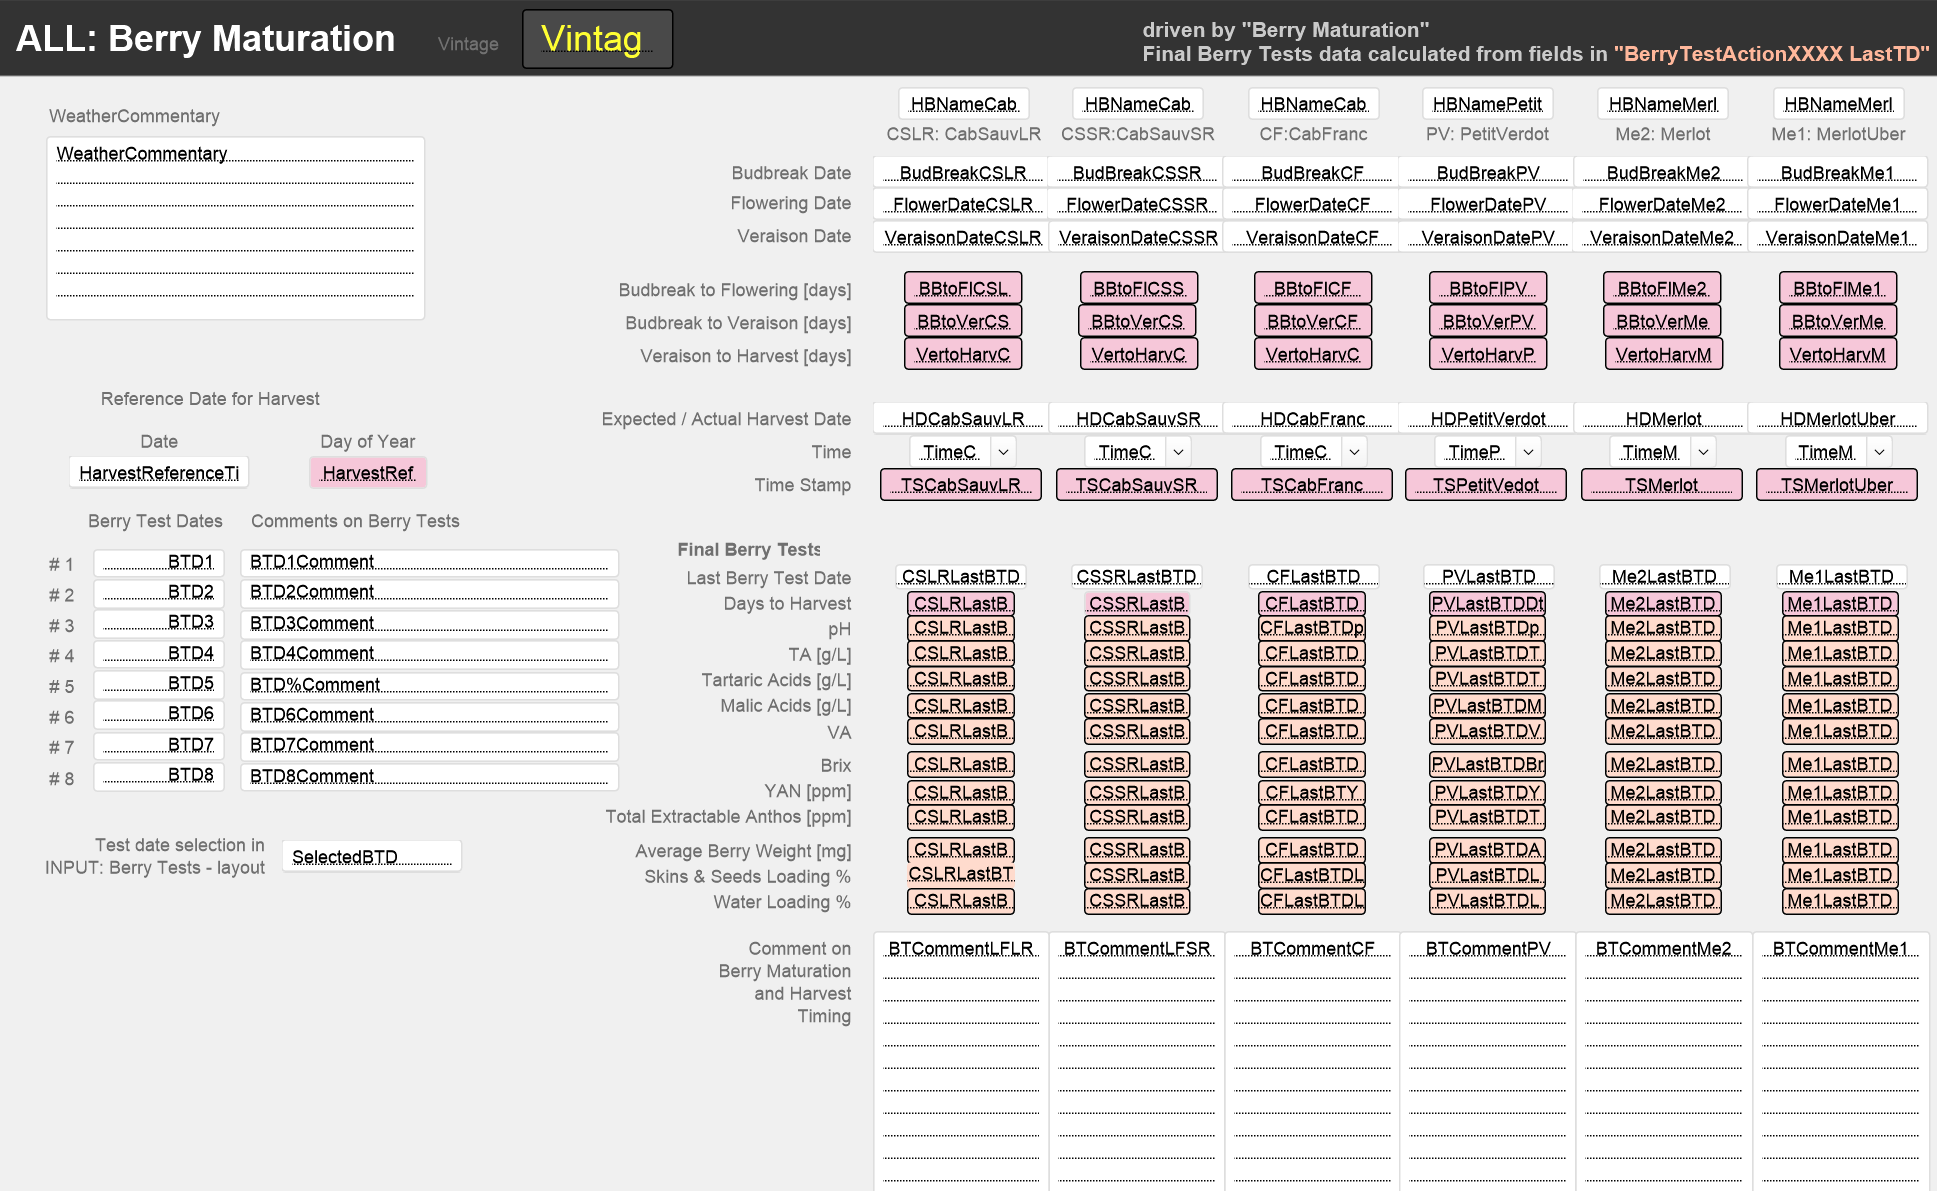
We use this table to record dates and commentaries describing the maturation of the berries during each year before harvest. We estimate the dates and times upfront, and then update them during the berry testing period. The key dates are Bud Break, Flowering, Mid-Veraison, different BerryTests and finally Harvest. Most of the variables are defined for each of the 6 blocks: LFLR, LFSR, CF, PV, Me2 and Me1.

- Vintage: number identifying vintage (e.g. 2016)
- BudBreakxxx: date of the first bud break in the xxx block
- FlowerDatexxx: date of first flowering in xxx the block
- VeraisonDatexxx: date of 50% veraison in the xxx block
- BBtoFIxxx = FlowerDatexxx – BudBreakxxx
- BBtoVerxxx = VeraisonDate – BedBreakxxx
- BTD1: date of first Berry Test
- BTD2: date of second Berry Test, etc. to BTD8
- HDxxx: Harvest Date for xxx block
- VertoHarxxx = HDxxx - VeraisonDatexxx
- Timexxx: Harvest Start Time for xxx block
- TSxxx: Calculated Time Stamp for xxx block
- HarvestReferenceTimeStamp: Reference Time Stamp defined for entire vintage
- HarvestReferenceTimeStampN: Calculated number for HarvestReferenceTimeStamp
The BerryMaturation table also holds the results of the last Berry Test of the vintage for each block. This is accomplished by the following linkage to different instances of the BerryTestAction table
The screenshots show the layout with field names and the data from the berry maturation in 2017 for the 6 vineyard blocks.

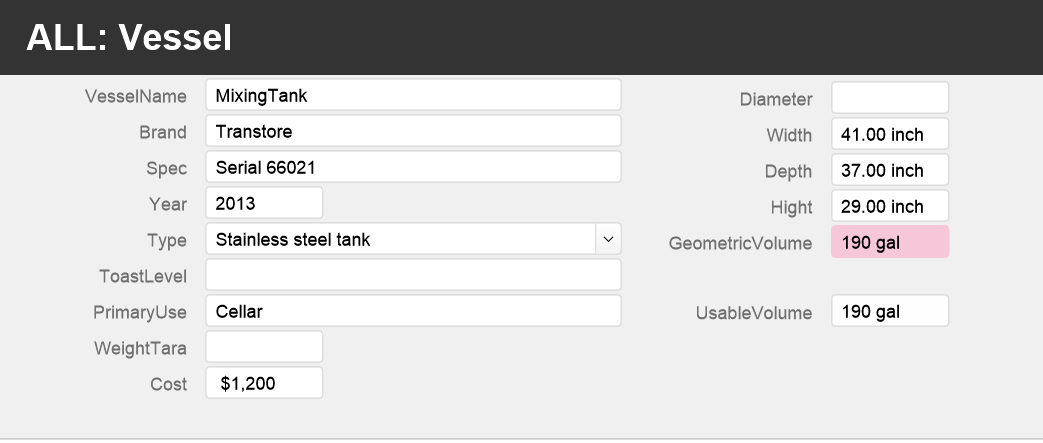
Vessels
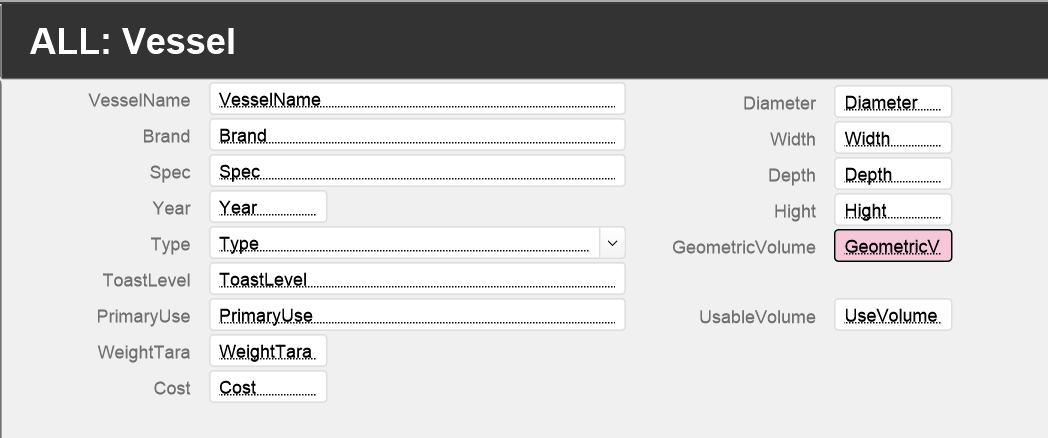
This table holds descriptions of the vessels we use to hold grapes, must, young wine or maturing wine.
We will add descriptions of the individual fields later.
The screenshots show the layout with field names and, for example, the record for the Transtore Mixing Tank
This screenshot shows the listing of all vessels as of January 2018

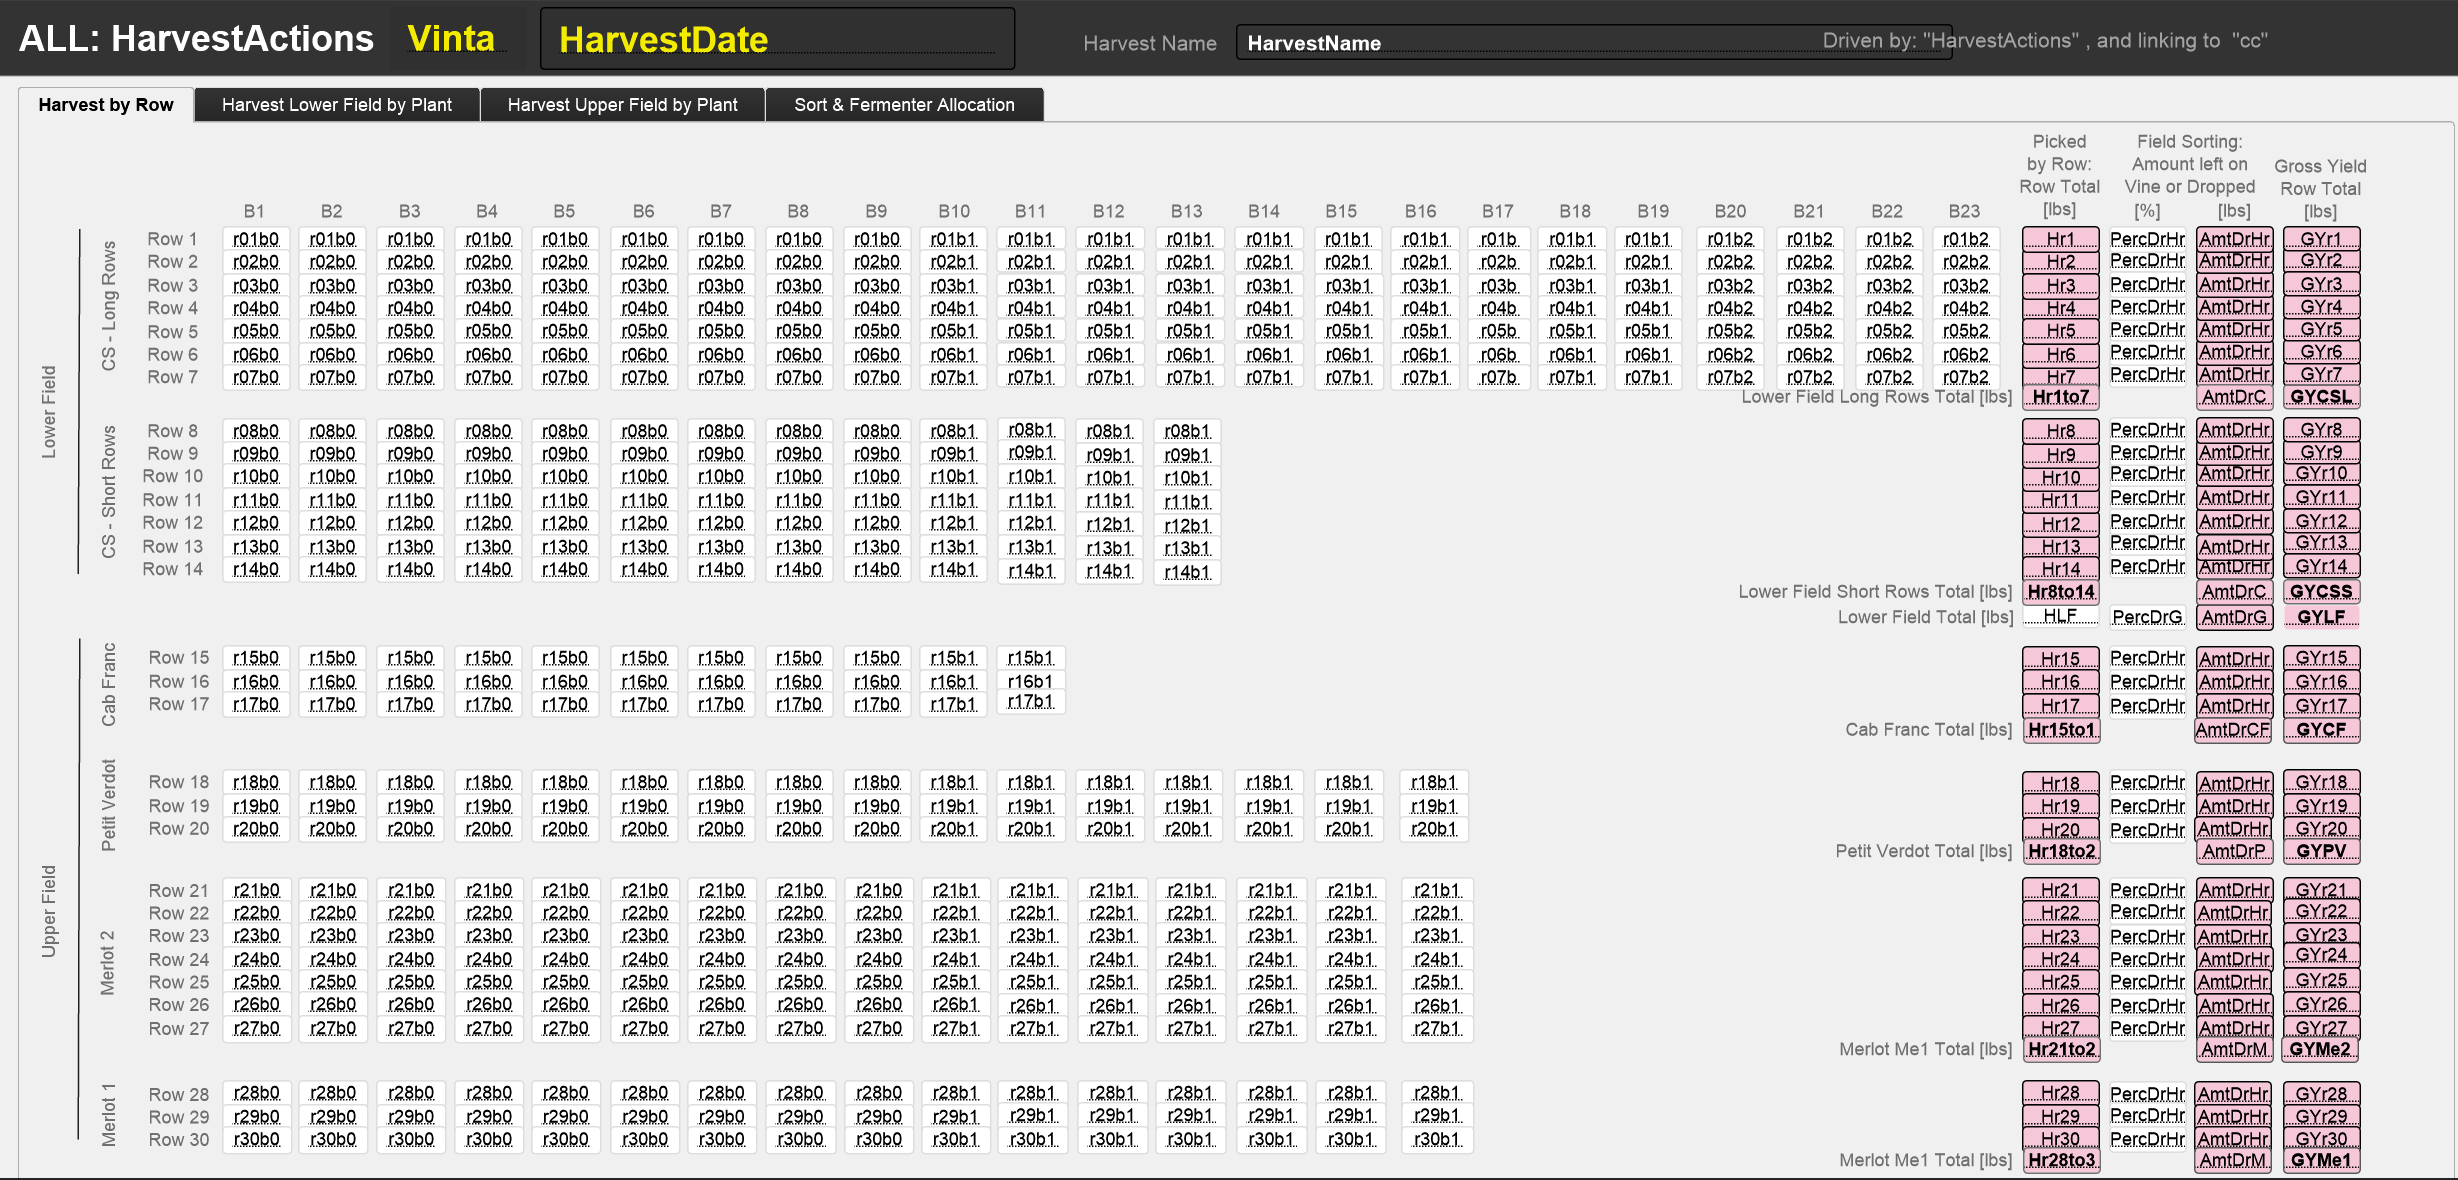
HarvestActions
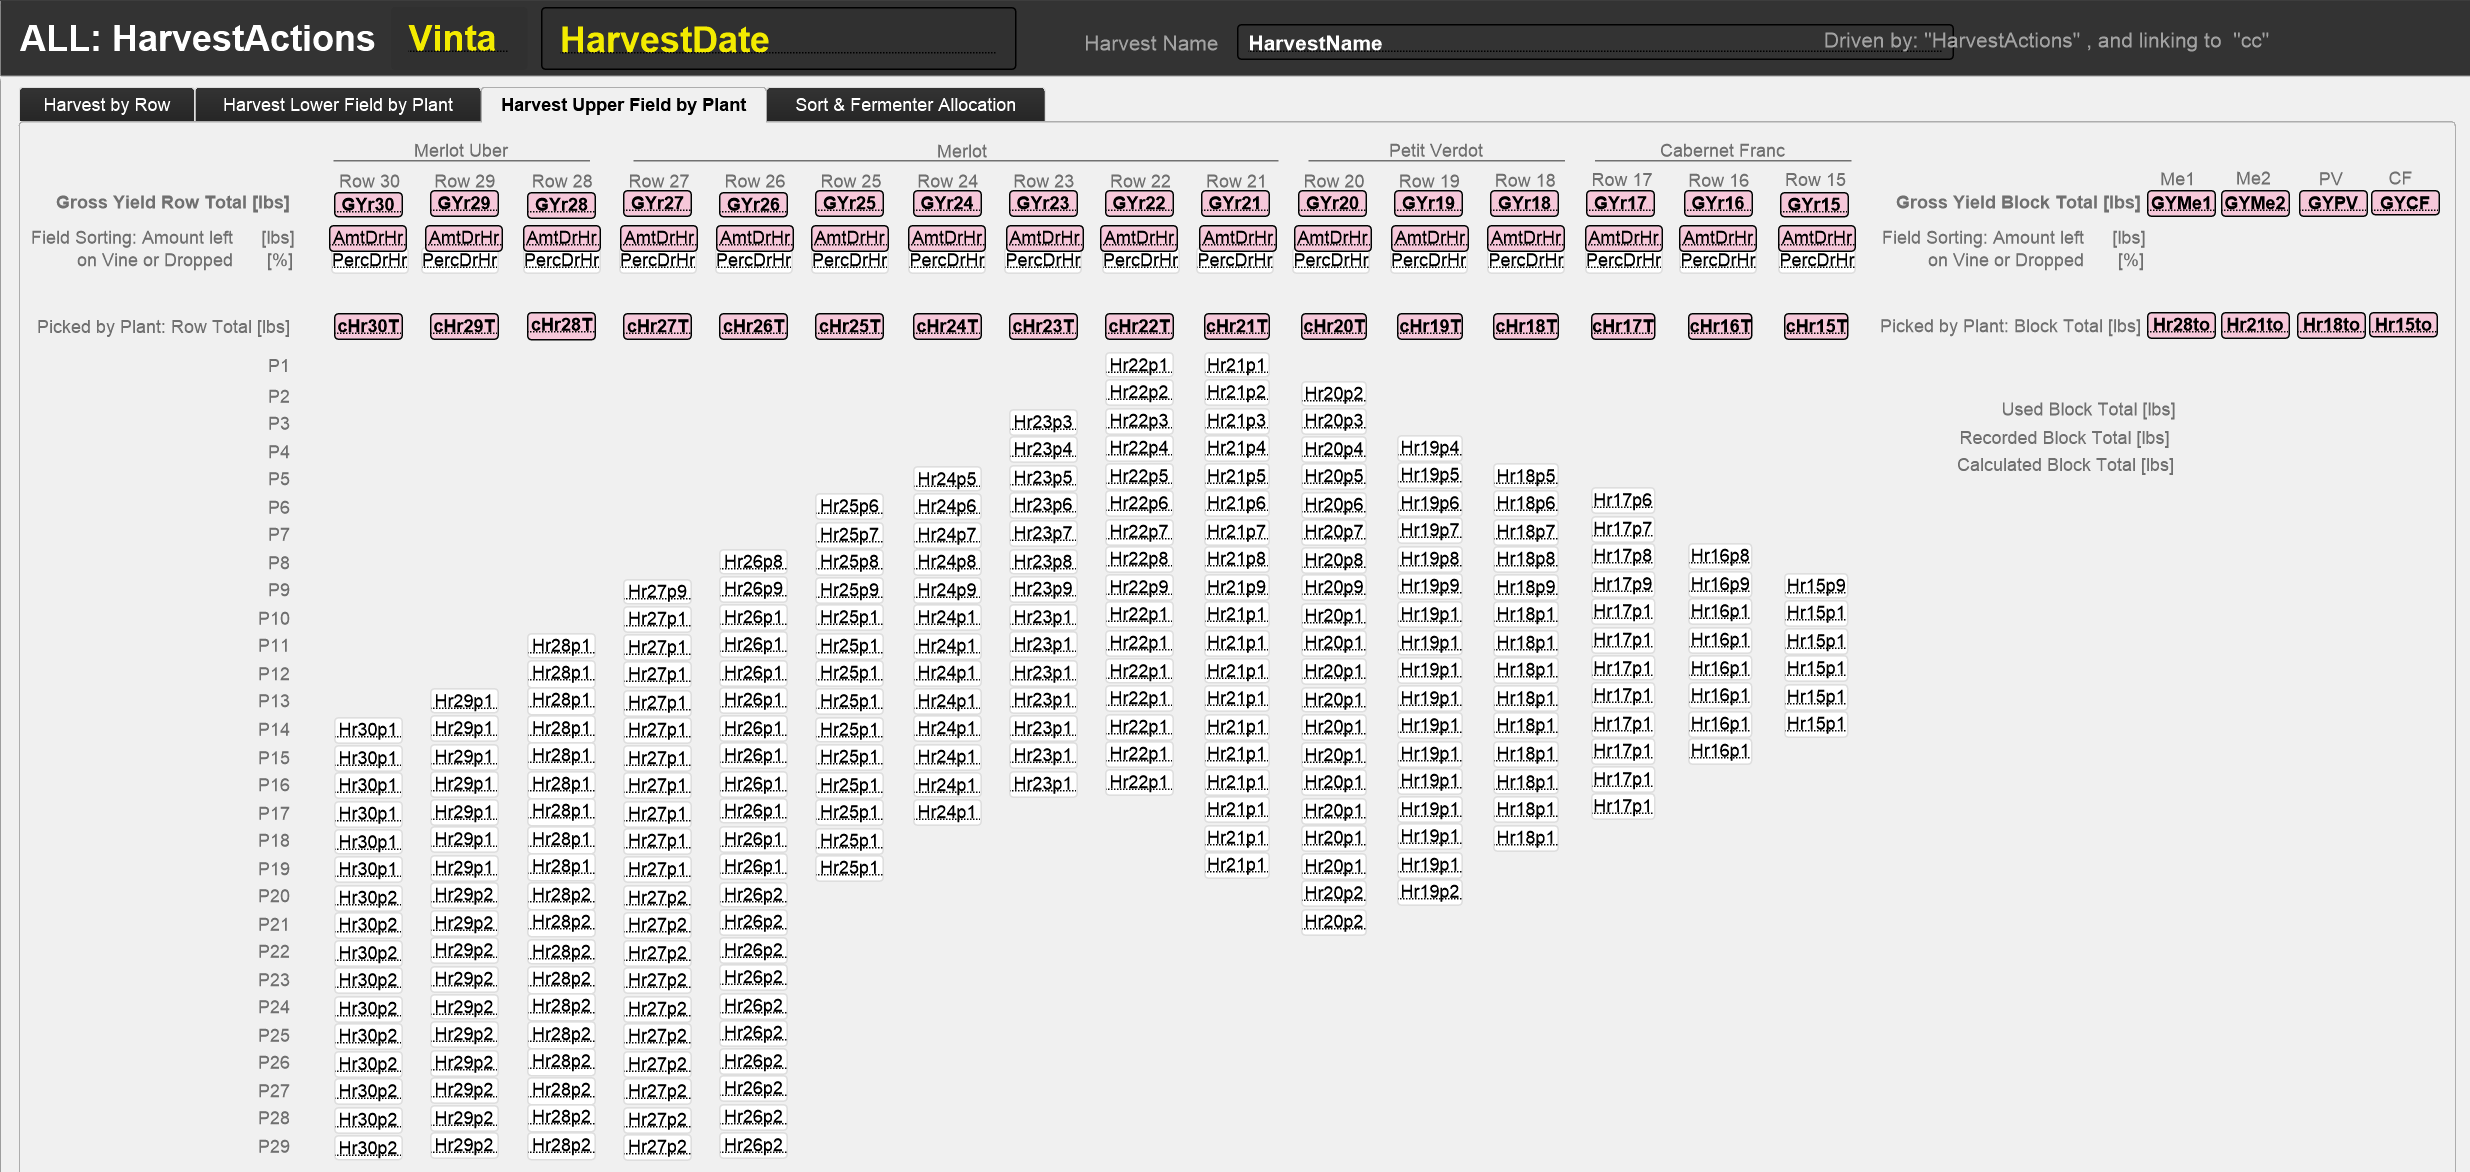
We use this table for each harvest 1) to record the Yield by plant, by row or by harvest block, 2) to record how much of that yield is lost in bunch sorting, in destemming and berry sorting, and 3) how the net yield is allocated to different fermentation batches. There can be multiple harvests in each Vintage year, each defined by its HarvestDate. Before the HarvestAction table can be used, the Fermentation Batches have to be defined in the FermBatchDefinitions table. The table thus contains four types of data: a) Yields for each plant, row, or harvest block; b) Yield losses in processing and c) allocation of Net Yield to Fermentation Batches.
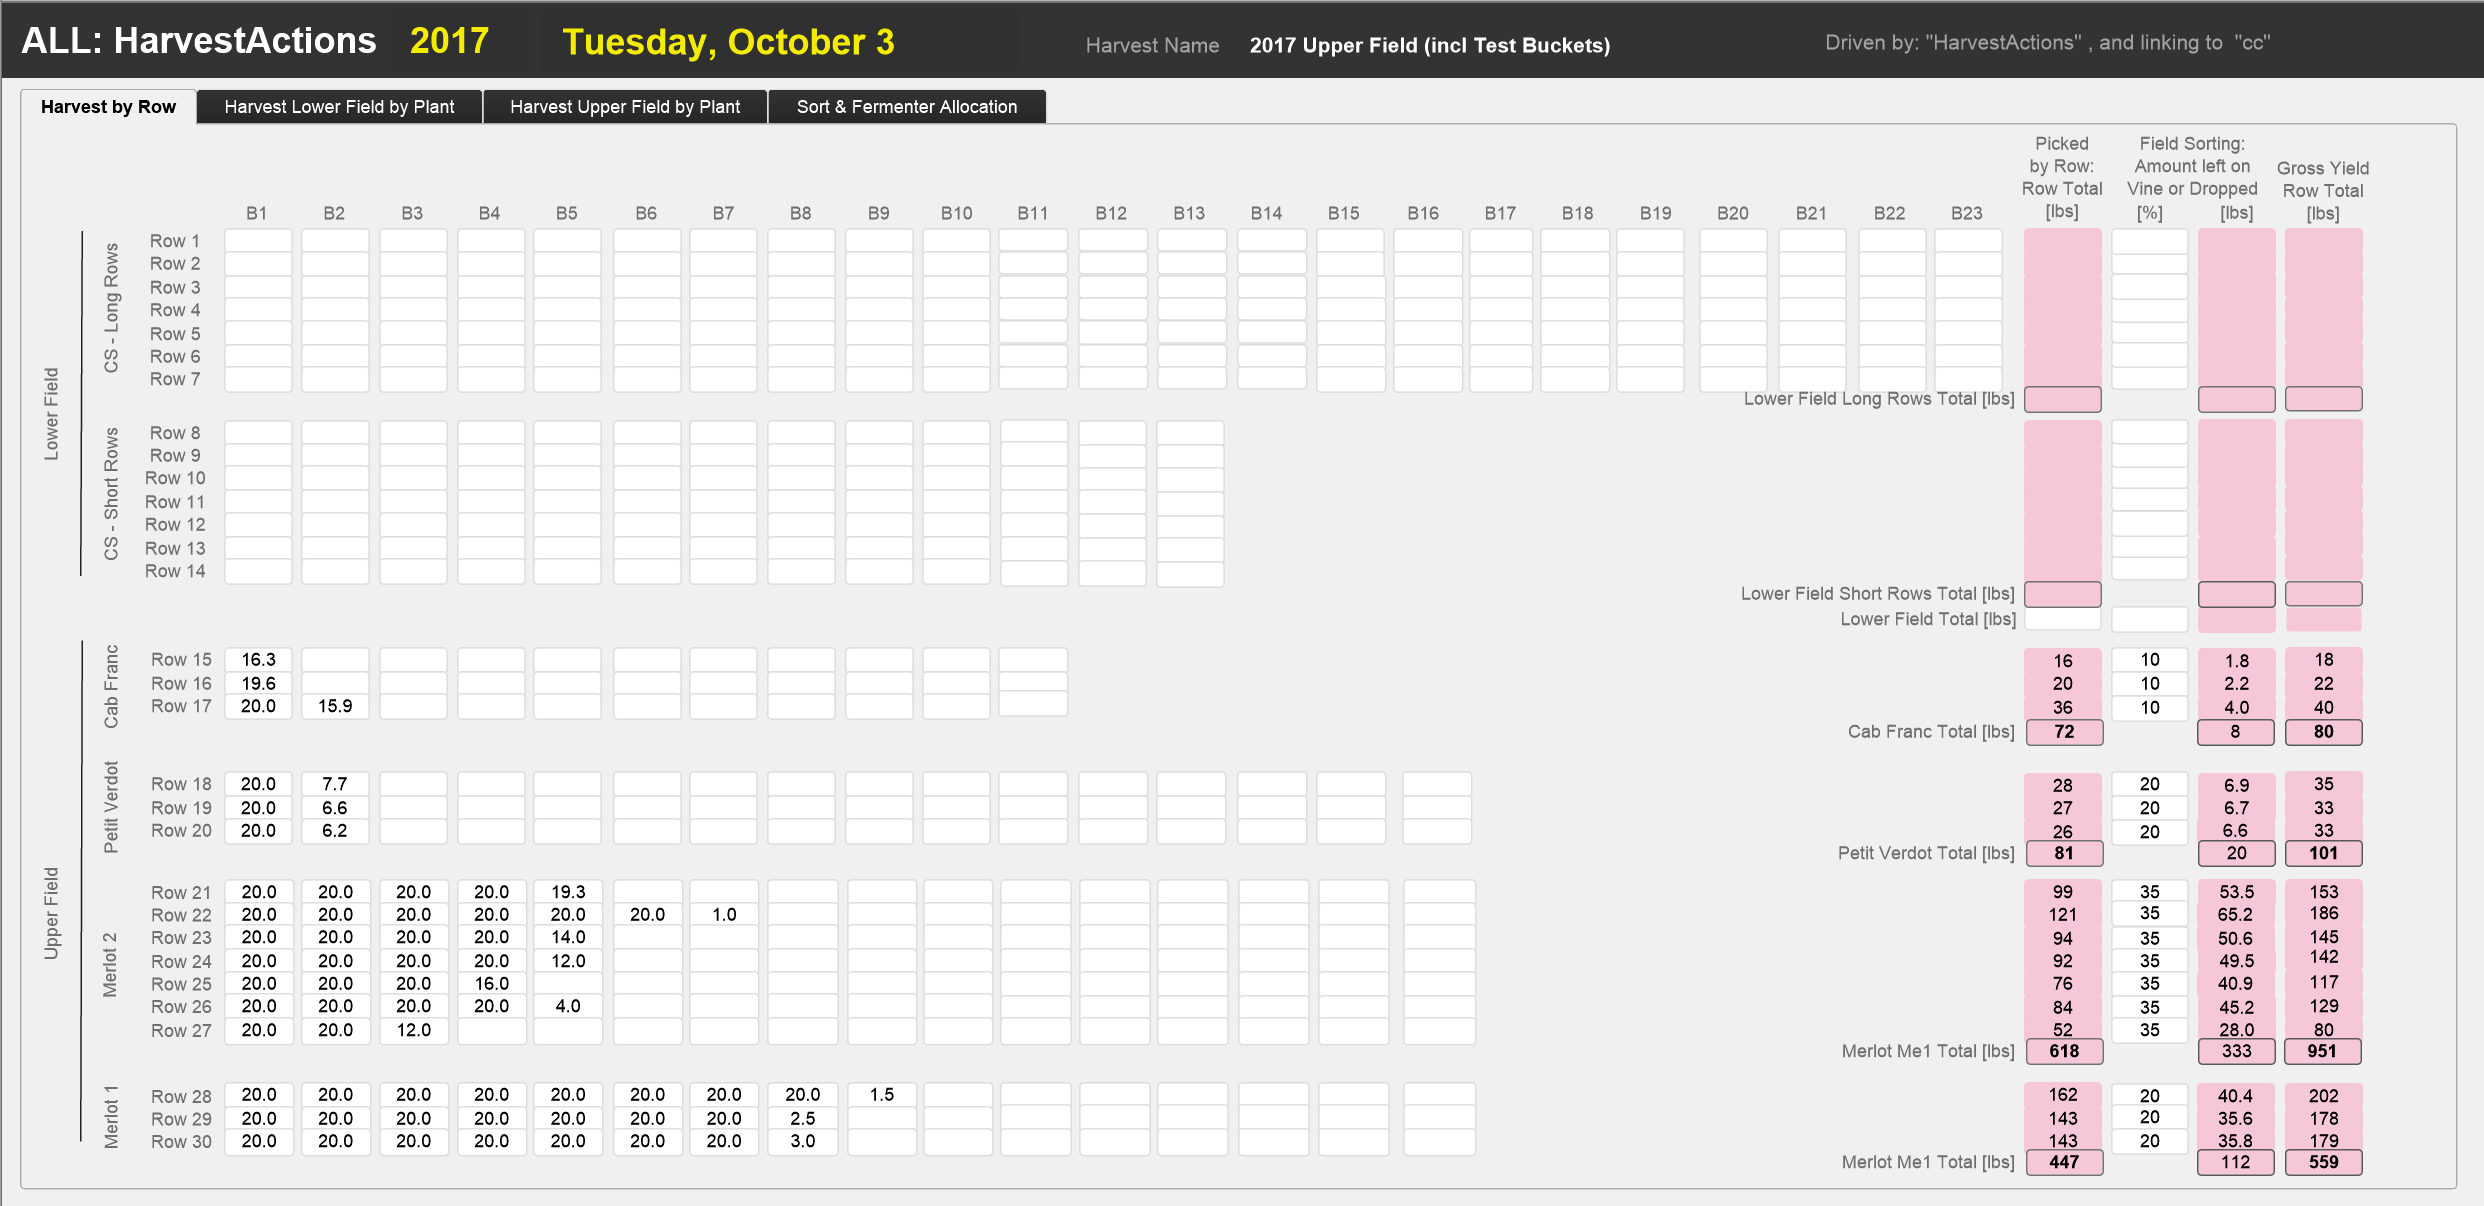
Because of the large number of variables, we needed to divide the layout into 4 tabs. The first tab shows how the yields are recorded by row and aggregated into blocks. We collect the bunches by bucket which identify the number of the row they come from. We weigh each bucket and sum up the numbers by row. Then we estimate, for each row, the percentage of weight dropped in the vineyard or left on the vine to calculate a gross yield per row.
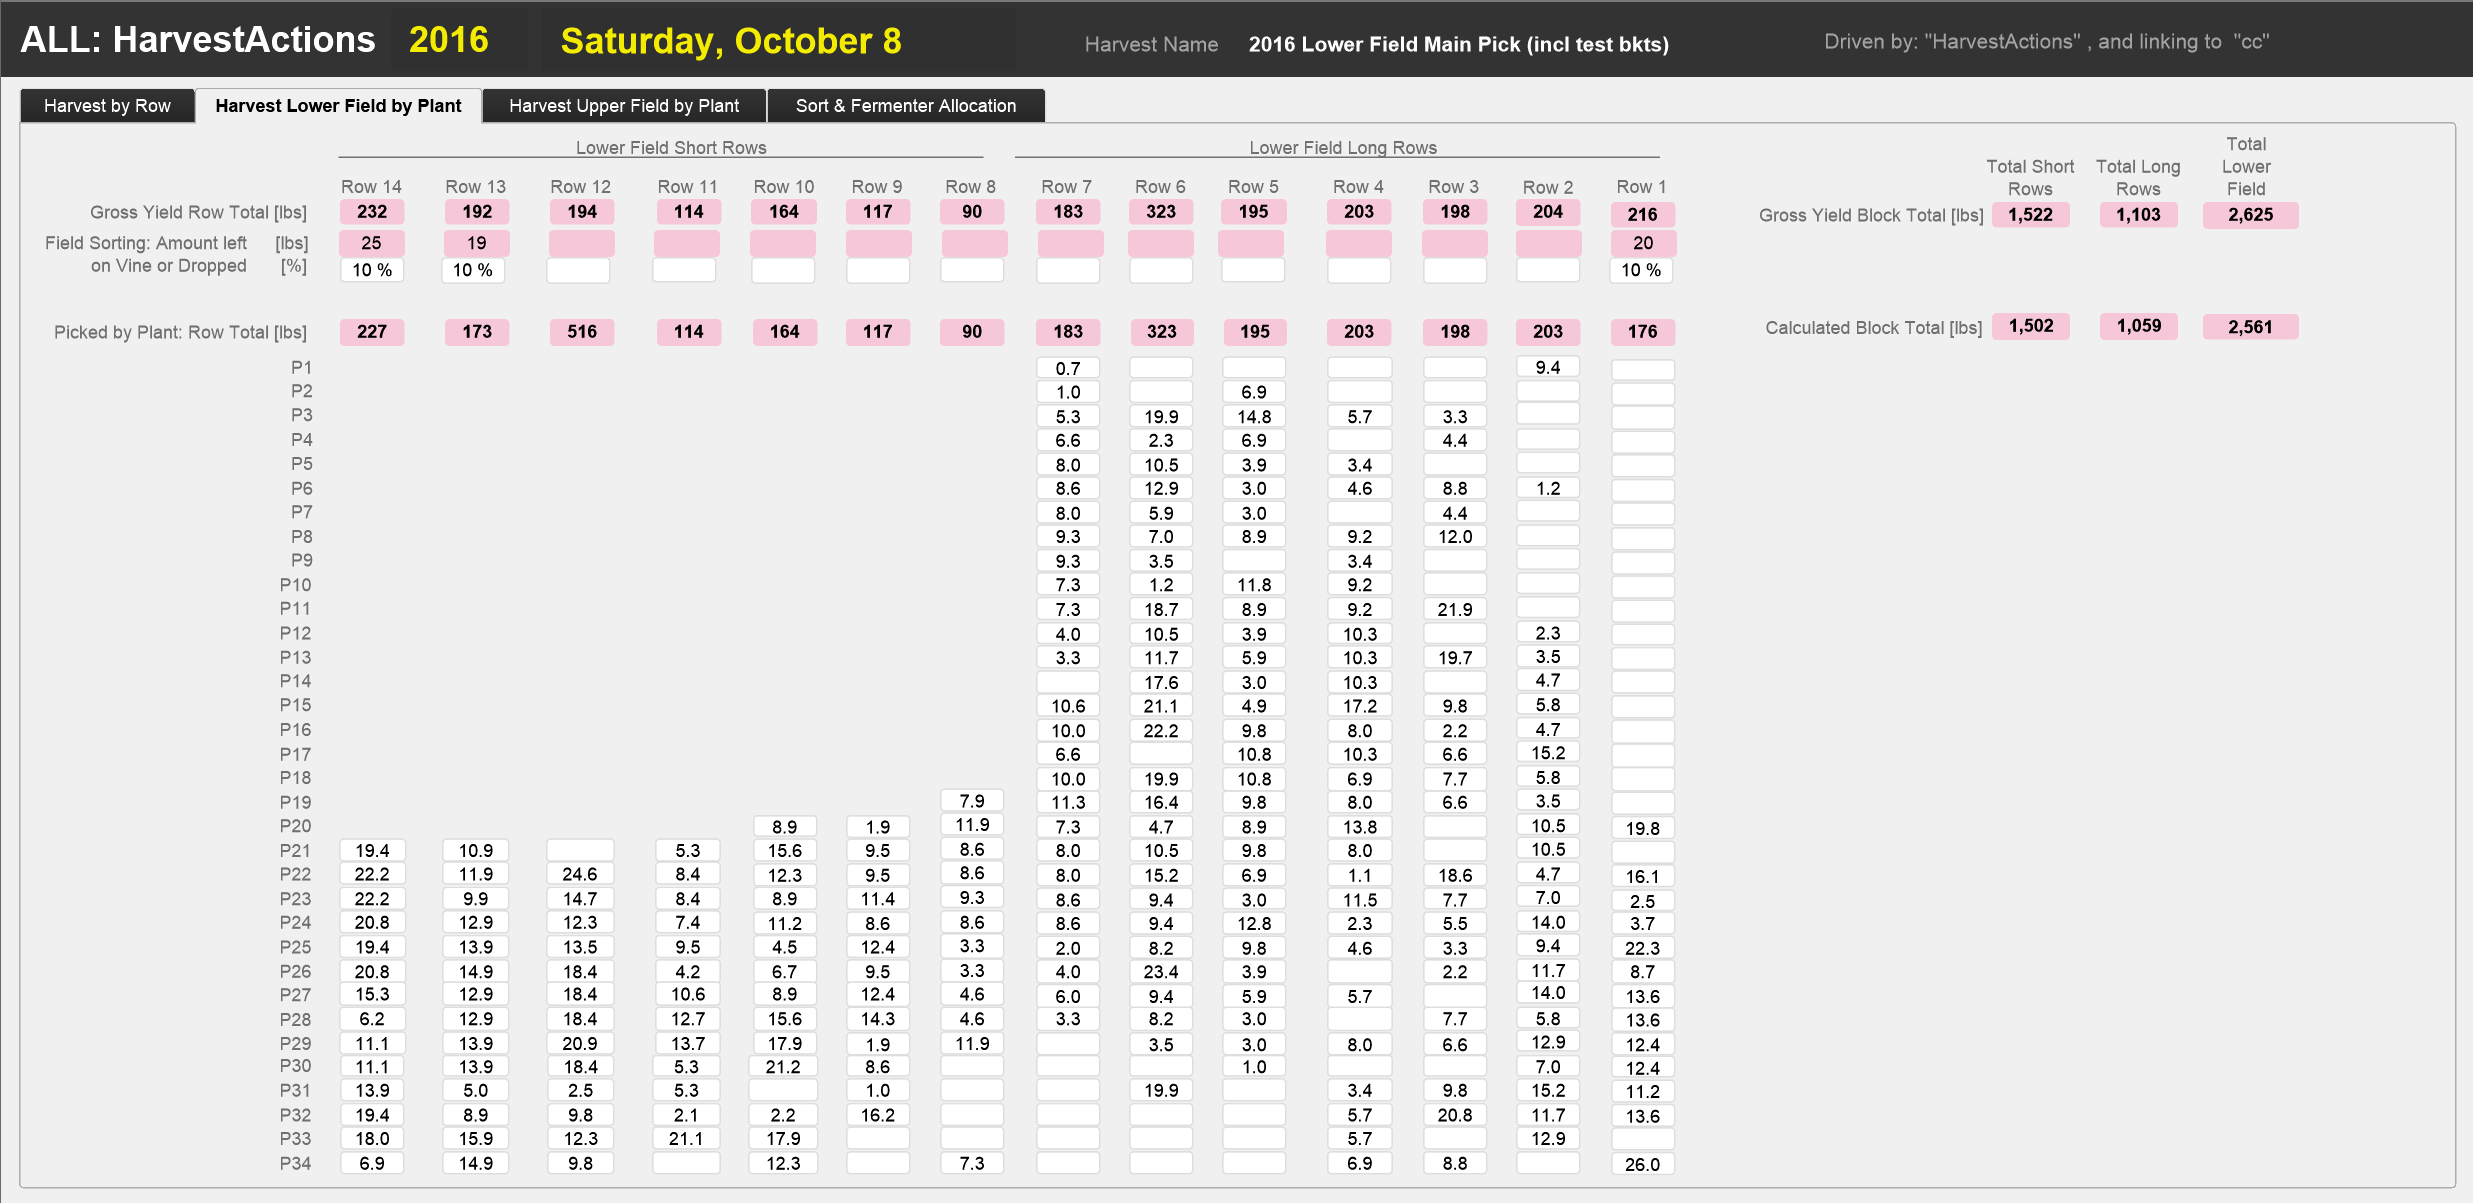
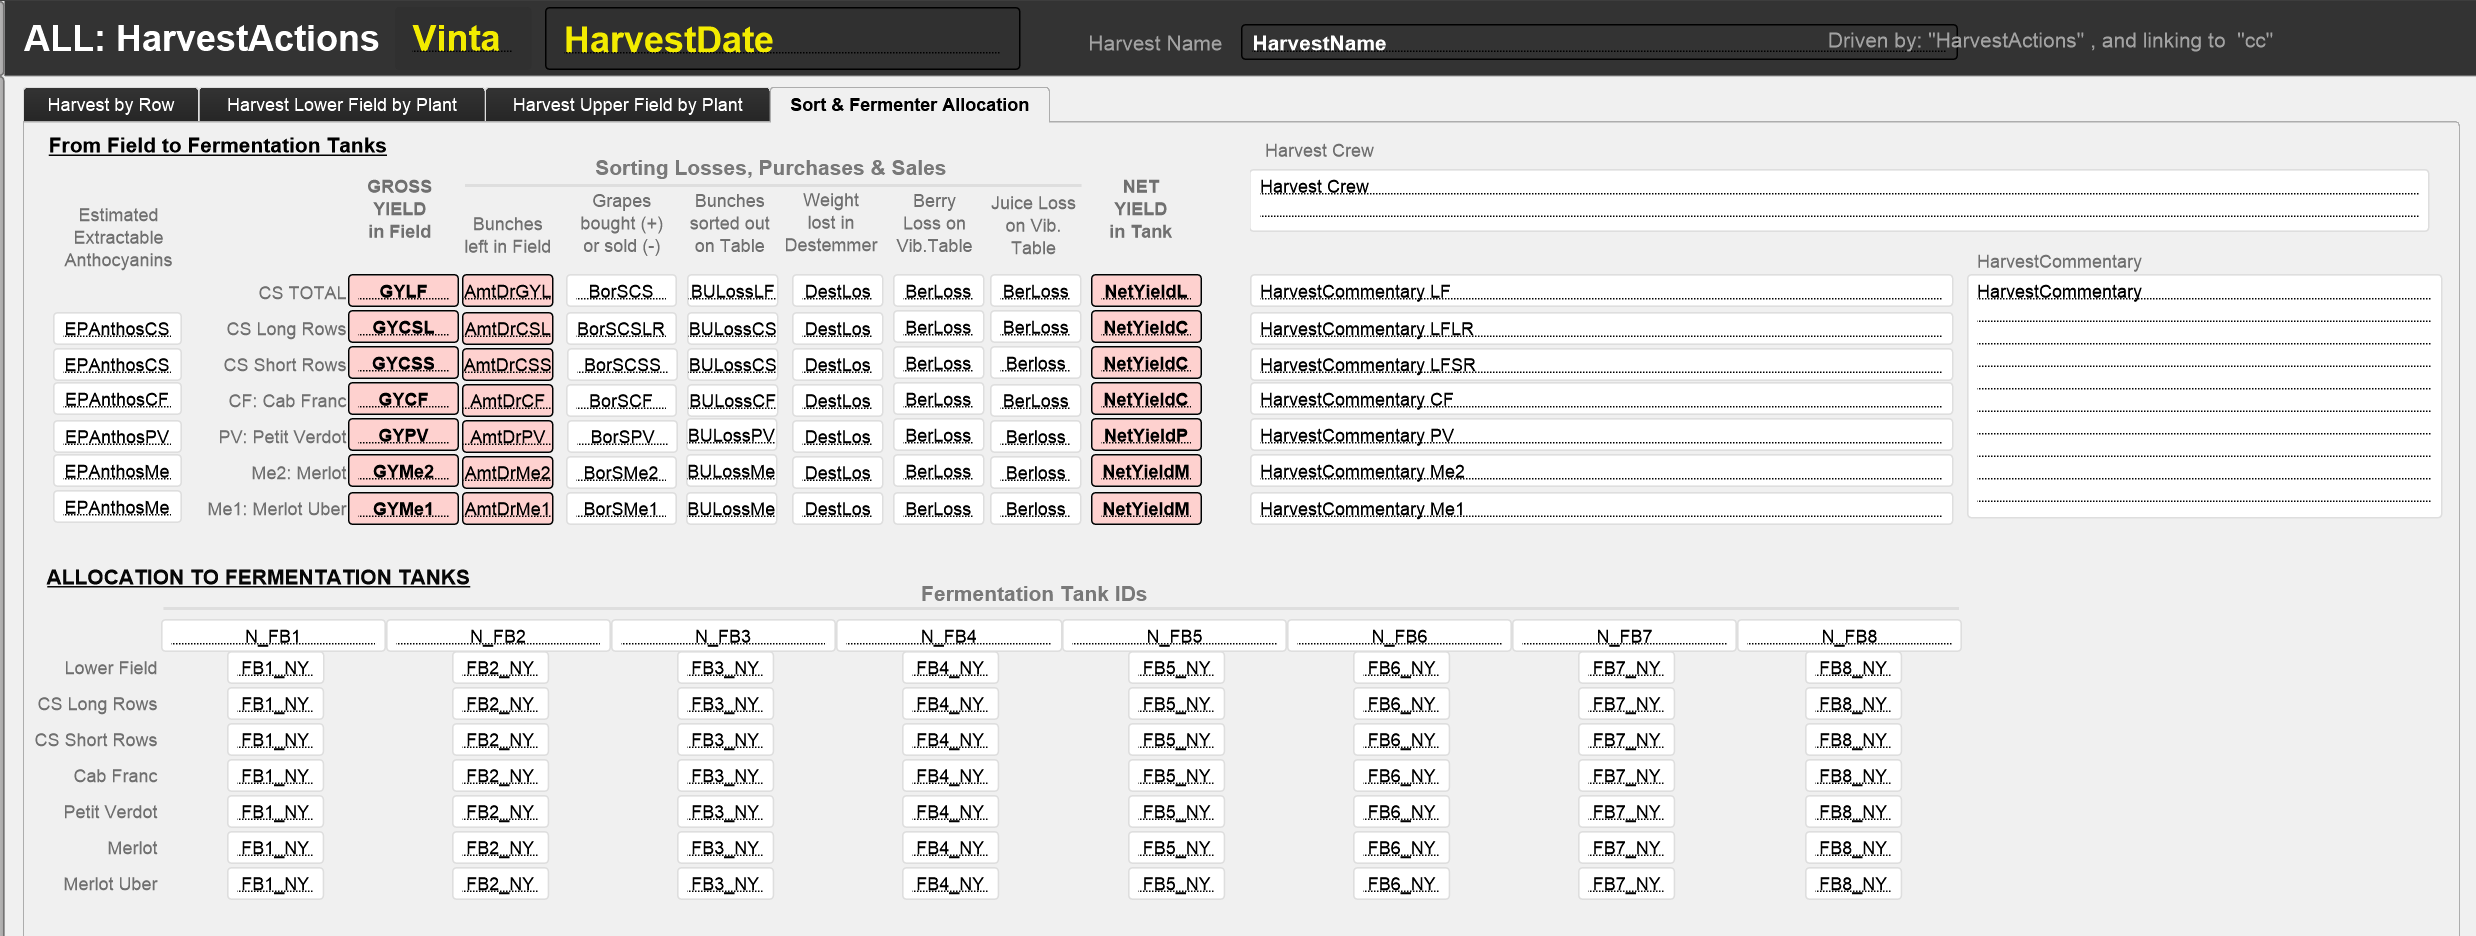
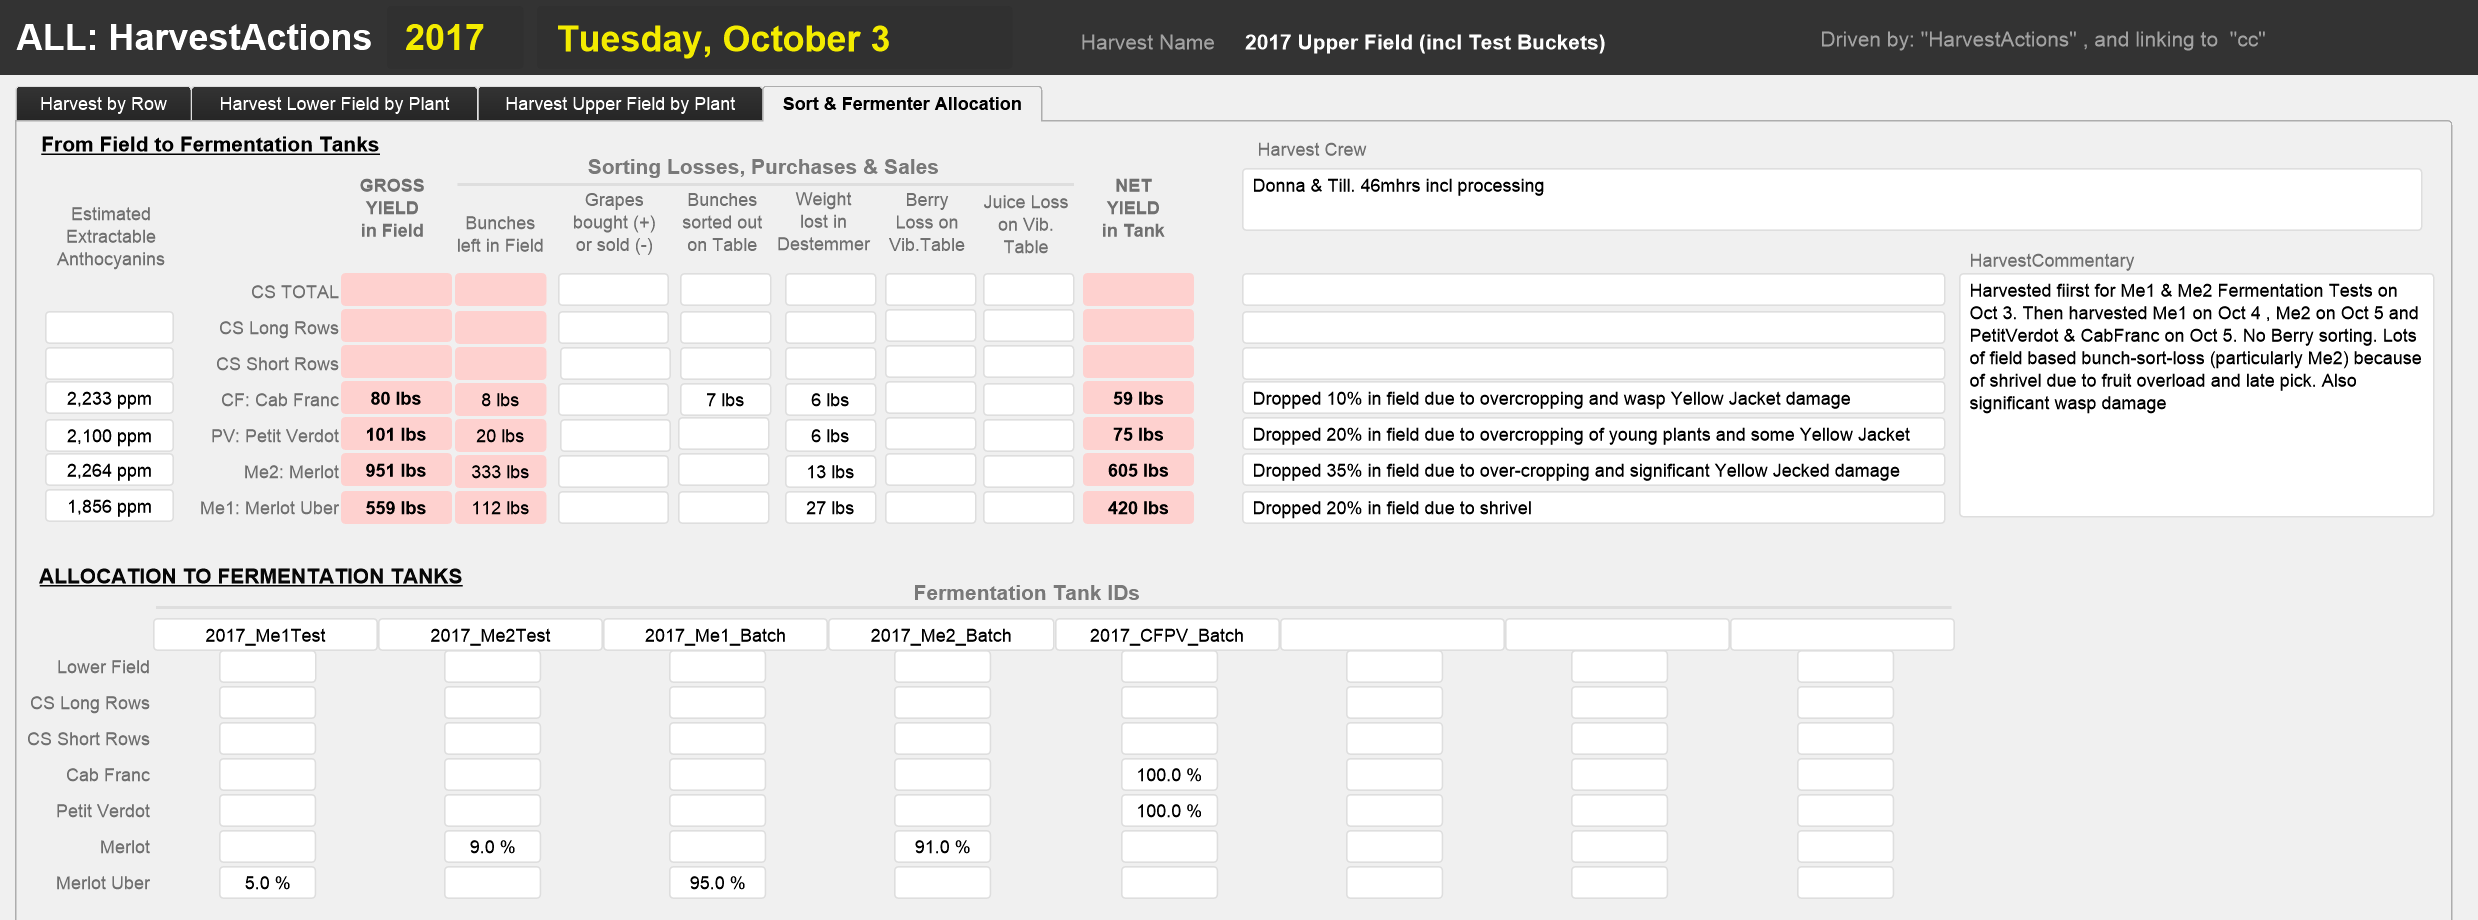
These screenshots show first the names of the fields in tab 1 (“Harvest by Row”) the recorded data for the October 3, 2017 harvest of the Upper Field. The second and the third tabs are used in the years we record the yields per vine. In this instance, we collect in buckets which are identified by row and plant number. The next screenshot shows the names of the fields for tabs 2 (Lower Field) and 3 (Upper Field), and the data collected for Sept 15, 2016 (harvest of the Upper Field) and October 8, 2016 (harvest Lower Field):The 4th tab is used to record the sorting losses, harvest commentaries and how the net yield is allocated, by percentage of the total, to the different fermentation tanks. The last set of screenshot shows the names of the variables and the data collected for the September 15, 2016 harvests of the Upper Field:


FermBatchDefinitions
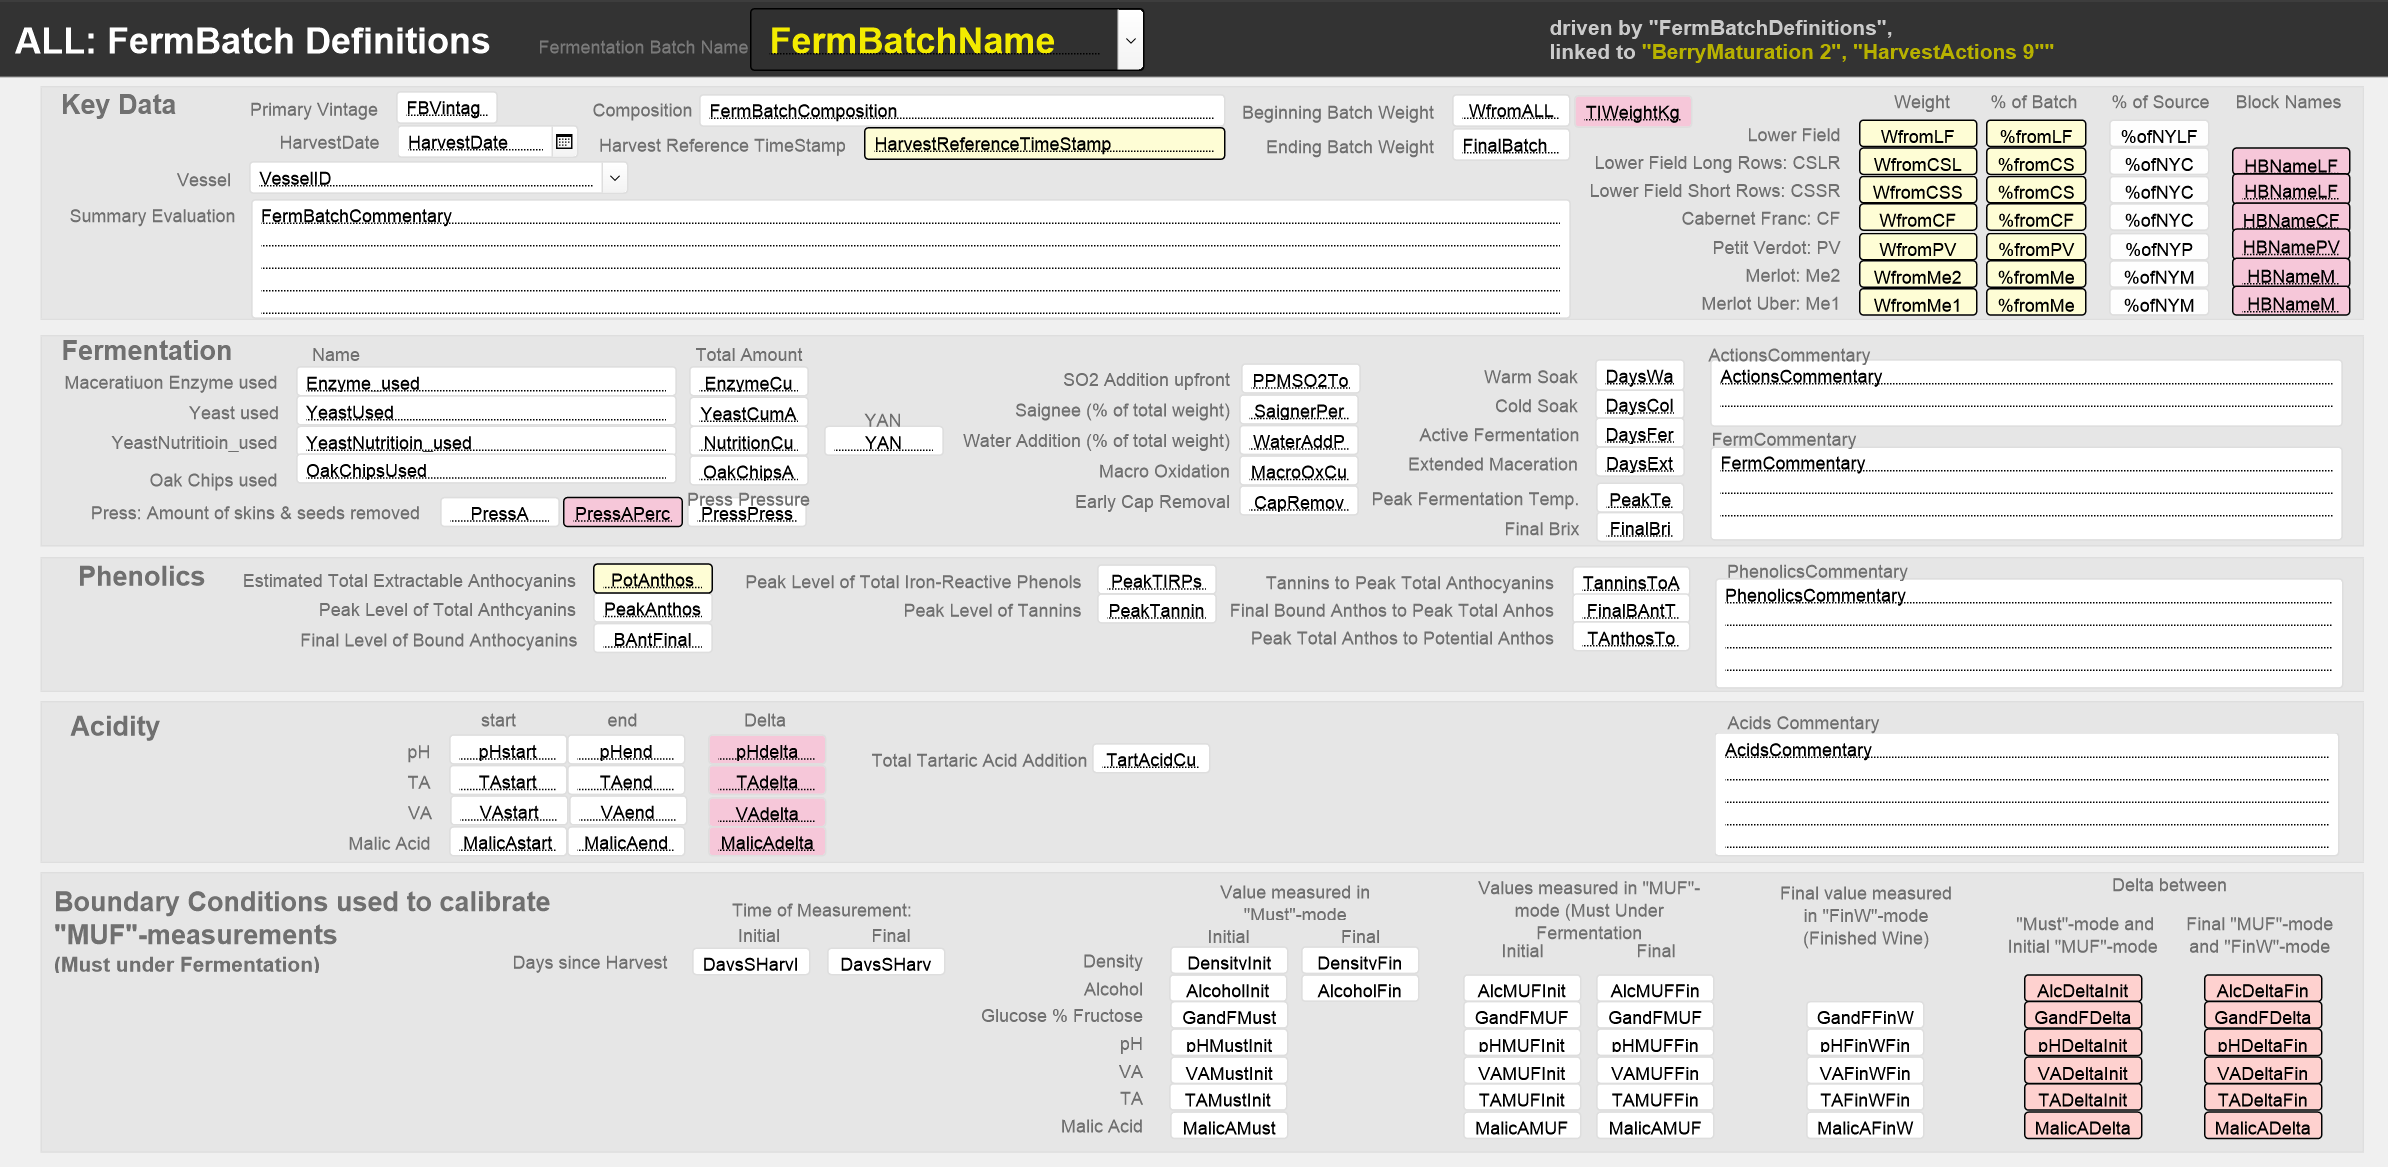
This table is used first, to define a Fermentation Batch and, second, to describe the result of the fermentation on its completion. A Fermentation Batch is defined merely by creating a new record and giving it a FermBatchName. This has to happen for all fermentation batches associated with a given harvest. Otherwise sorted berries cannot be allocated to it in the HarvestActions table described above.
We will add descriptions of the individual fields later.
The screenshots show the layout with field names and, for example, the definition of the “2016MePVCF”-batch. We enter most of the data for the fields in this table during the review of the fermentation (See REVIEW: FermBatch)

FermentationActions
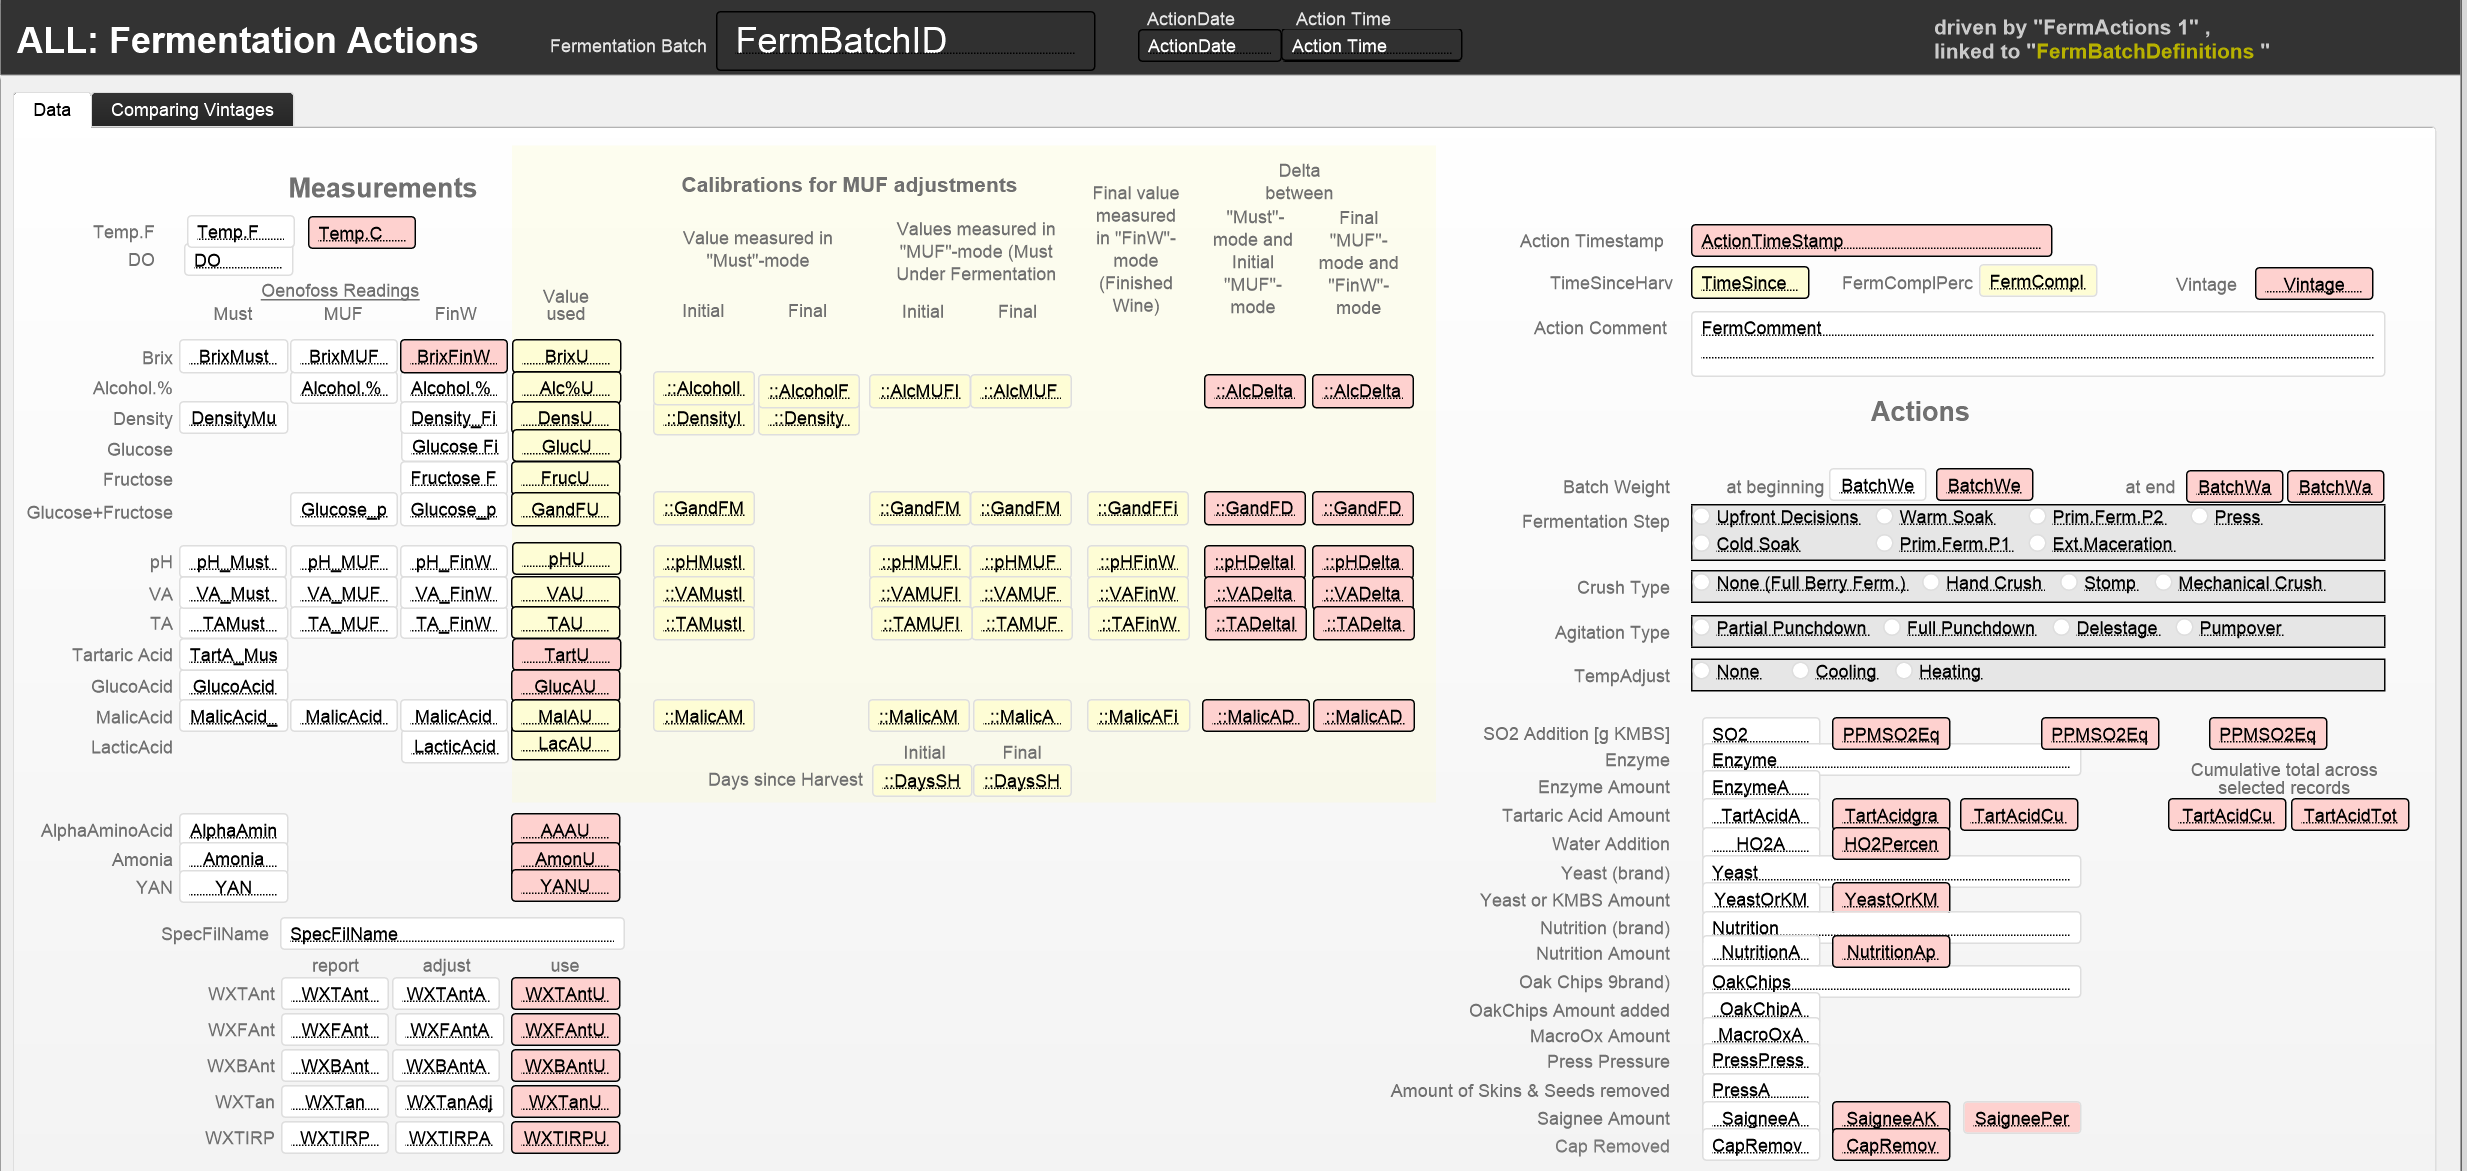
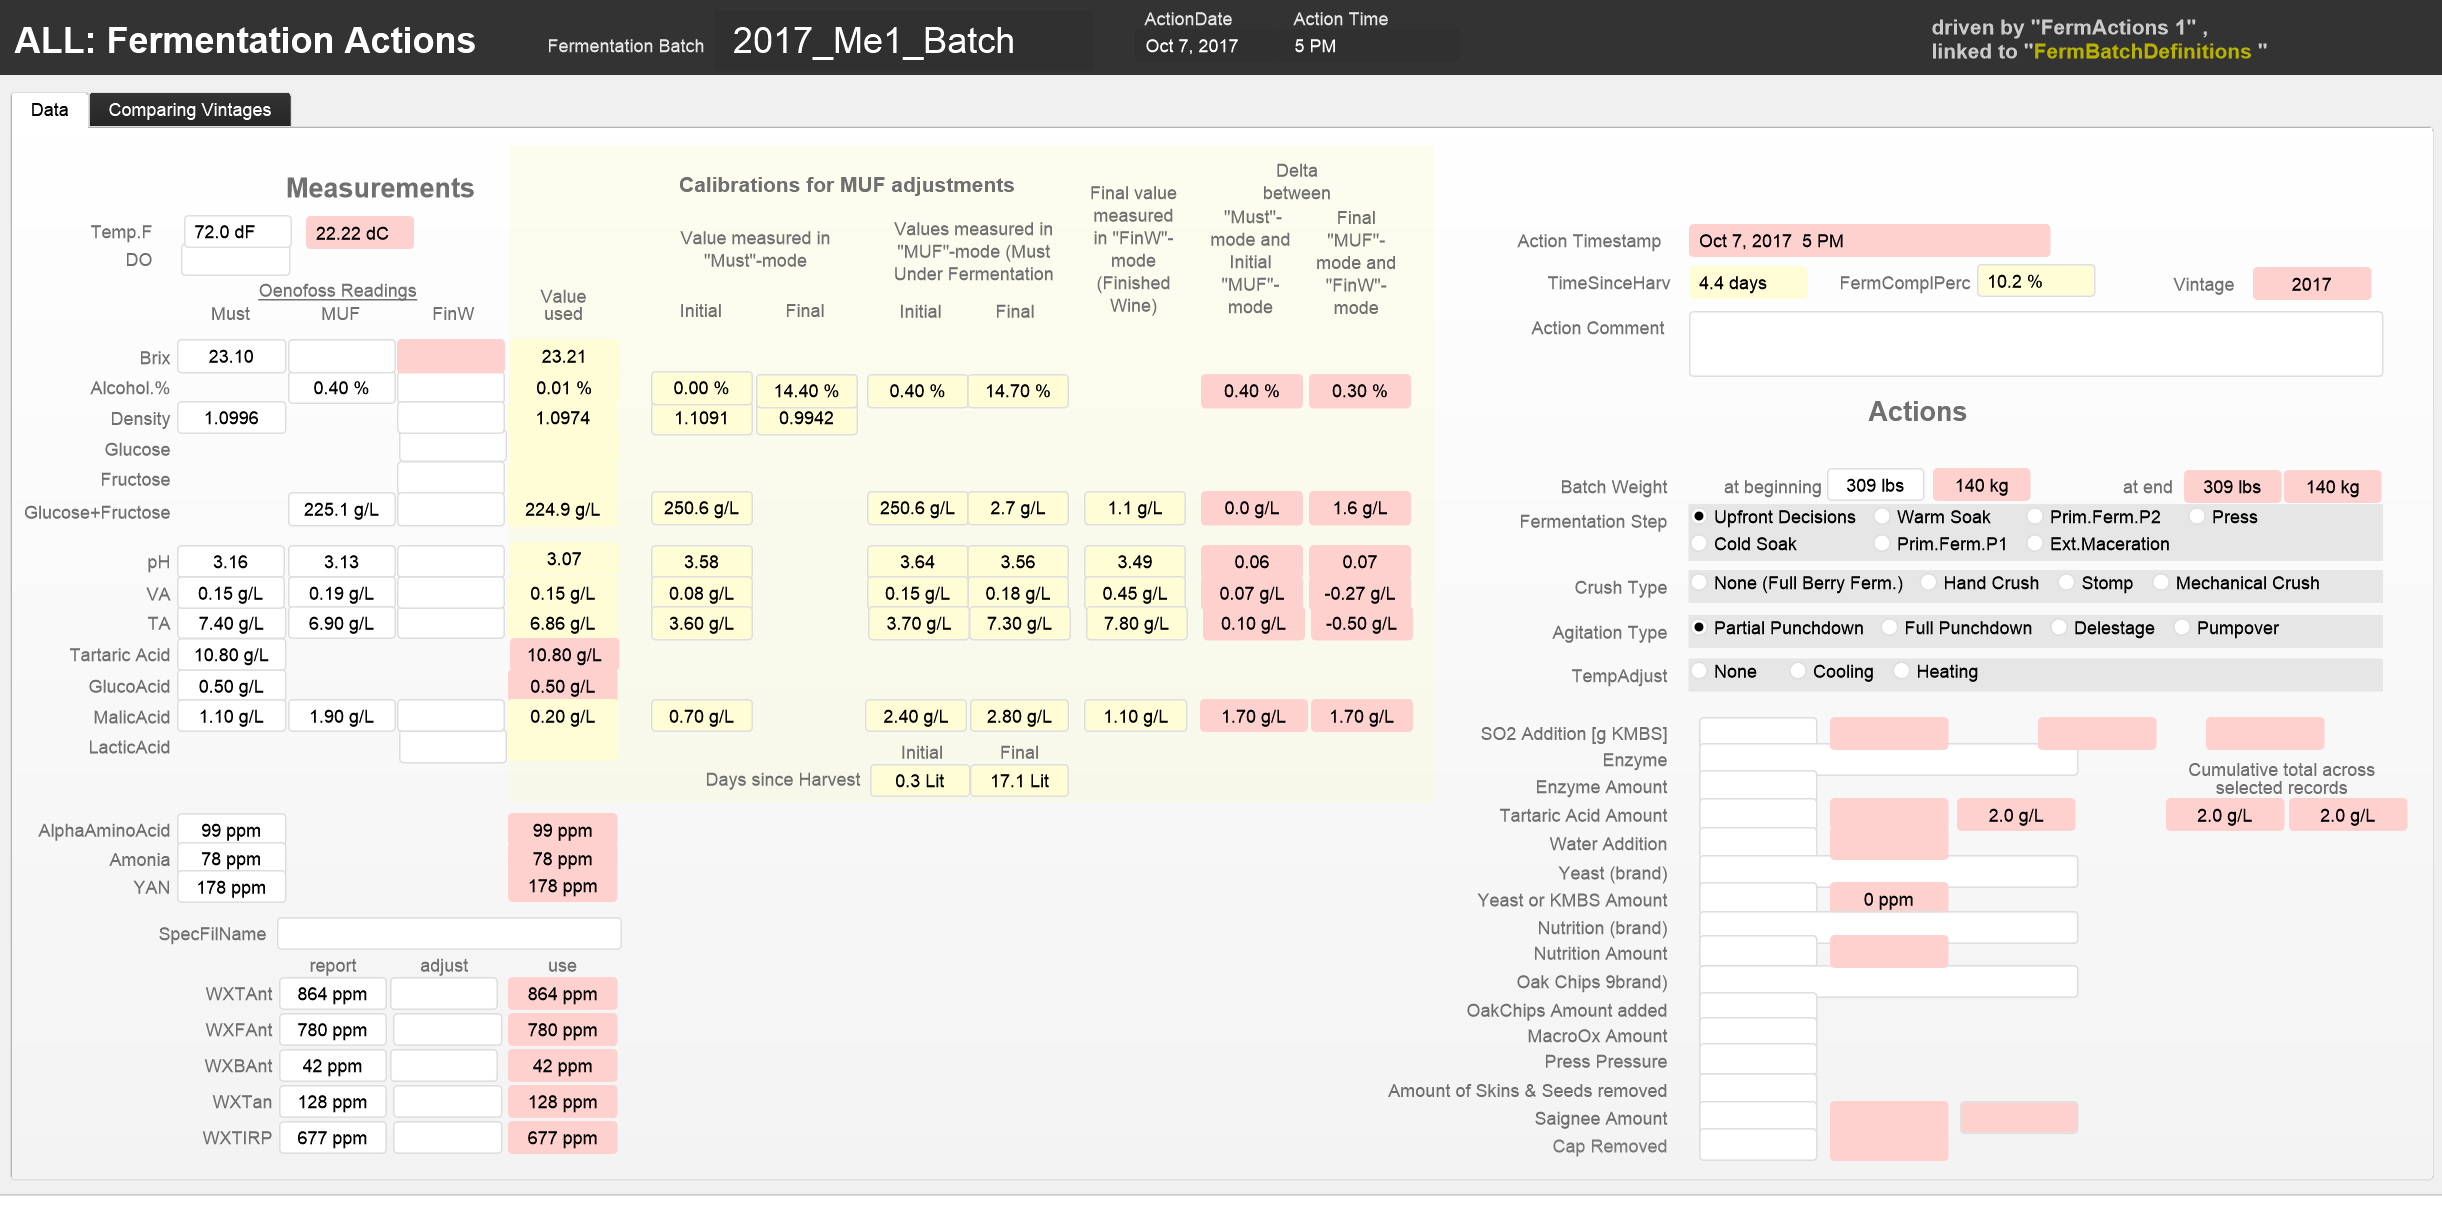
Records in this table hold the descriptions of all the winemaking actions during fermentation: measuring chemical properties, punching down the cap, adjusting acidity, etc. To measure chemical properties, we started using Oeno Foss in mid- 2017. Because must under fermentation is very unstable, OenoFoss does not provide calibrated results. So we need to adjust the uncalibrated results of OenoFoss Must-Under-Fermentation-measurements based on boundary conditions given be OenoFoss Must measurements and OenoFoss Finished Wine measurements. These boundary conditions are kept in the FermBatchDefinitions table.
Descriptions of each field will be added later.
The screenshots of the layout show the field names and, for example, the measurements and activities for the “2017_Me1_Batch” on October 7, 2017, at 5 pm.
Previous page:Tables for Vineyard Data
Top of page: Go
Next Page: Tables for Cellaring Data
Last updated: August 4, 2018