Layouts to Review data
This page describes the REVIEW layouts. They illustrate the power and utility of the database and are the most important information tools for managing the vineyard, winery and cellars.
We use these layouts to review the data and add commentaries and summary data to records. We continuously change and amend the REVIEW layouts as we learn to better interpret and use the data we collect. At this time we use the following 8 REVIEW layouts
- REVIEW: Field Locations to review what was and is planted where over time
- REVIEW: Nutrient Tests to review soil and foliar tests
- REVIEW: Vineyard Actions to review all activities in the vineyard each year
- REVIEW: Weather & Berry Maturation to review the weather and how berries matured
- REVIEW: Fermentation Batch to review how the fermentation evolved in each batch
- REVIEW: MUF Calibration to review the calibration of measurements during fermentation
- REVIEW: Cellar Batch to review how each barrel evolved during cellaring
- REVIEW: Vintage Processes to review each vintage from vineyard to bottle
REVIEW: Field Locations
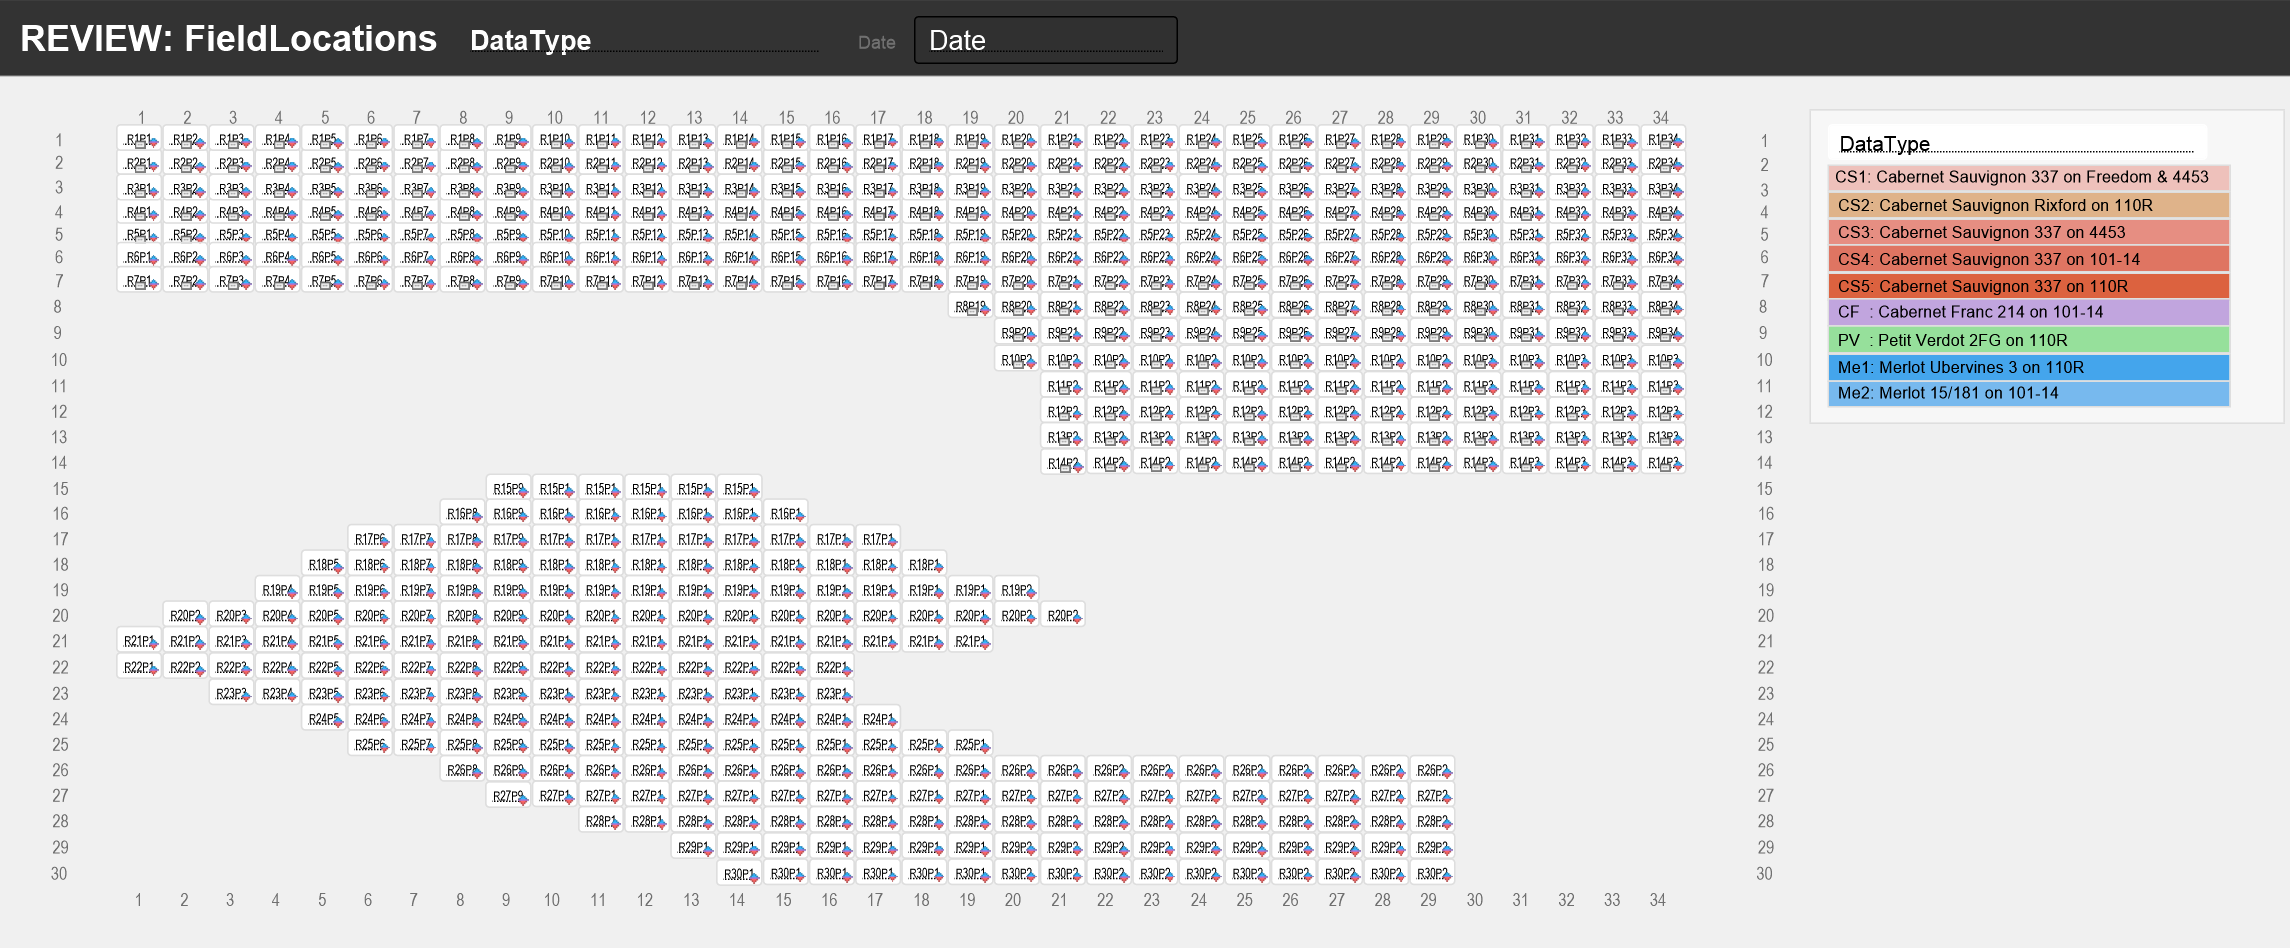
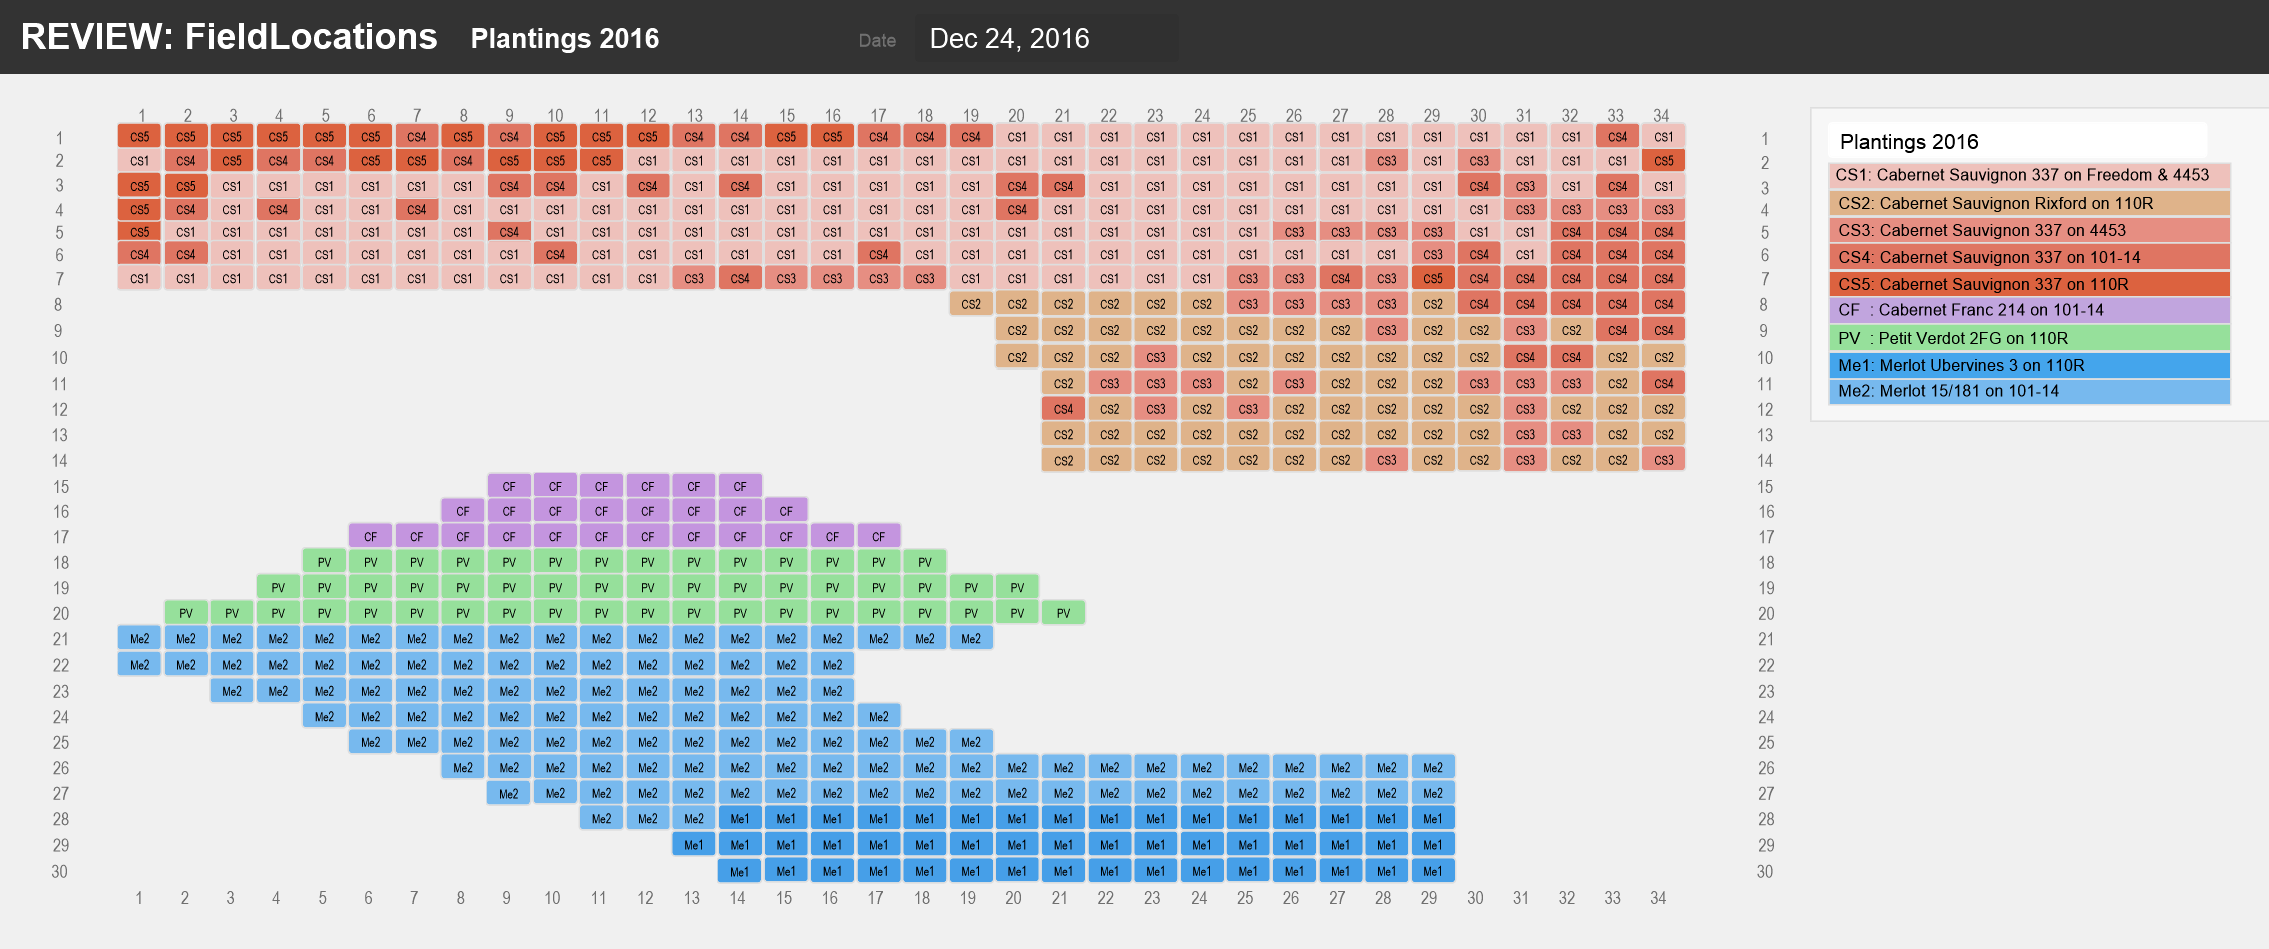
The layout REVIEW: Field Locations provides views on the status of the vineyard by plant. We currently use this layout to show the evolution of plantings. Essentially, each record holds a description of what is planted in each plant location.
The following screenshots show the layout with the field names and, for example, the rootstock/vine combination in each plant location at the end of 2016
REVIEW: Nutrient Tests
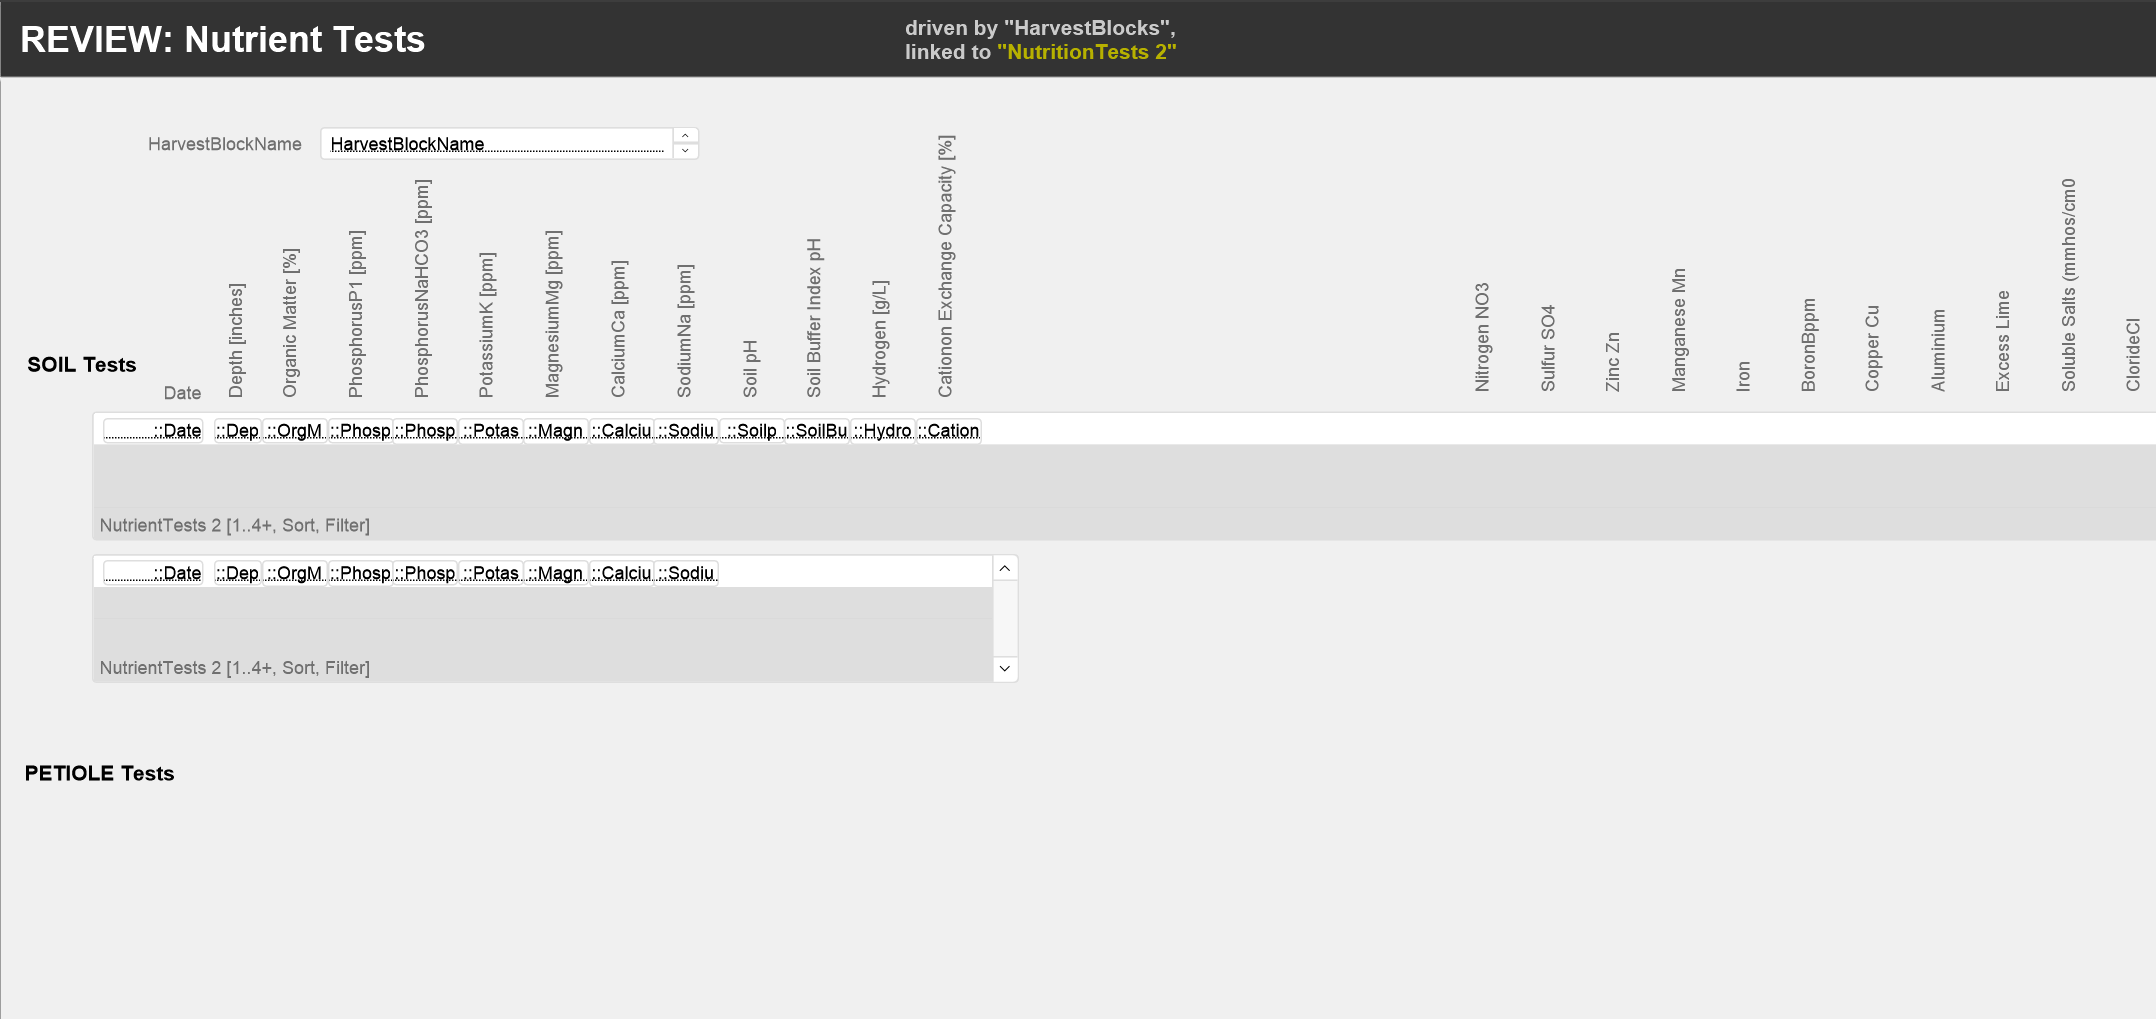
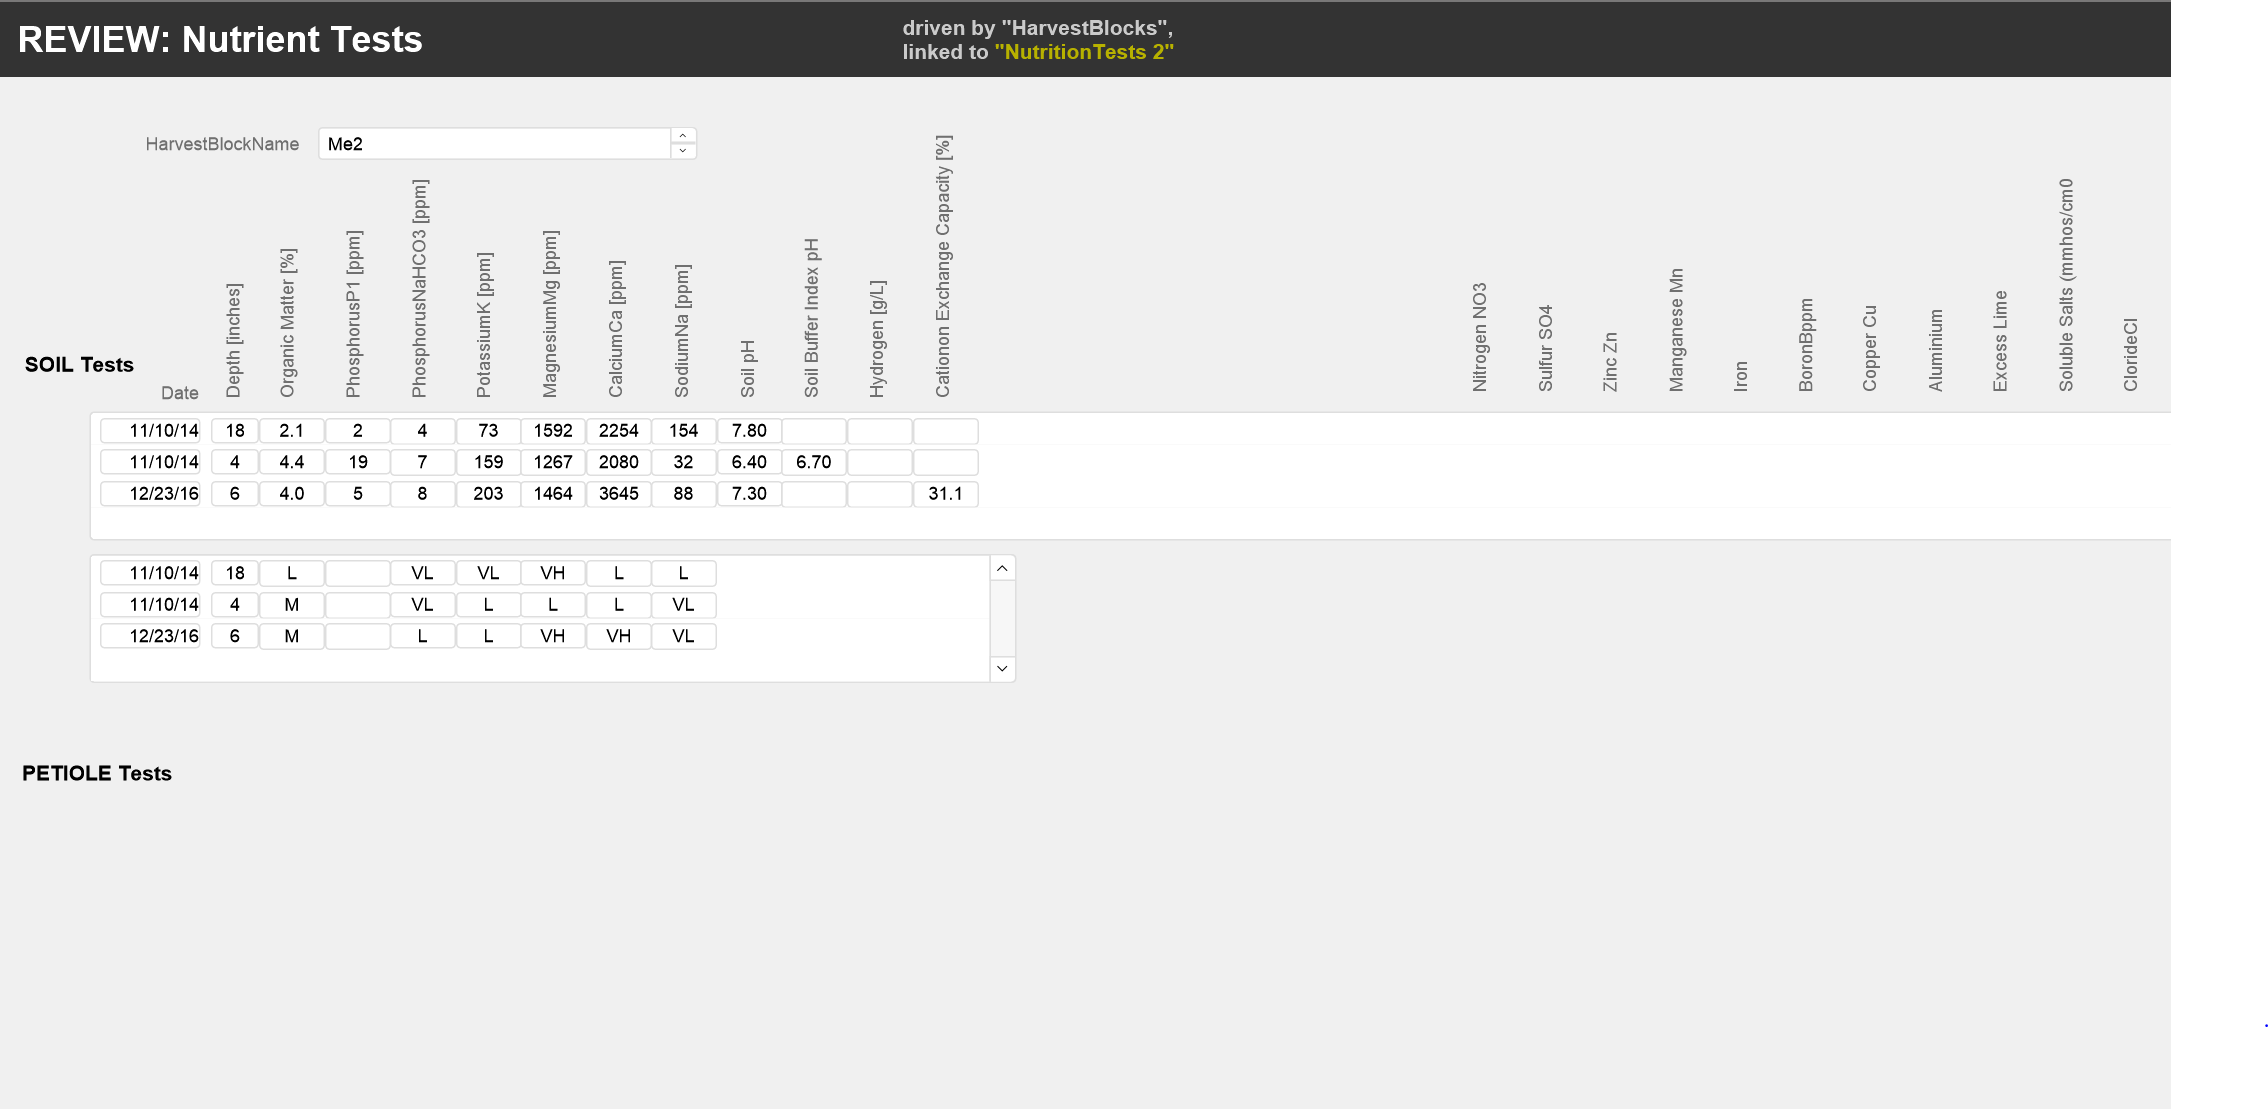
The layout “REVIEW: Nutrient Tests” summarises the results from past soil and petiole tests by block. We use this layout to judge whether the plants have adequate nutrients in the soil (soil tests) and whether they are successful in pulling them out. We correct deficiencies with soil amendments and foliar sprays (see REVIEW: Vineyard Actions tab Sprays & Soil Additions.)
This layout is still under development. The following screenshots show the current state of the layout with the field names and, for example, the results from the soil tests in the LFLR block.
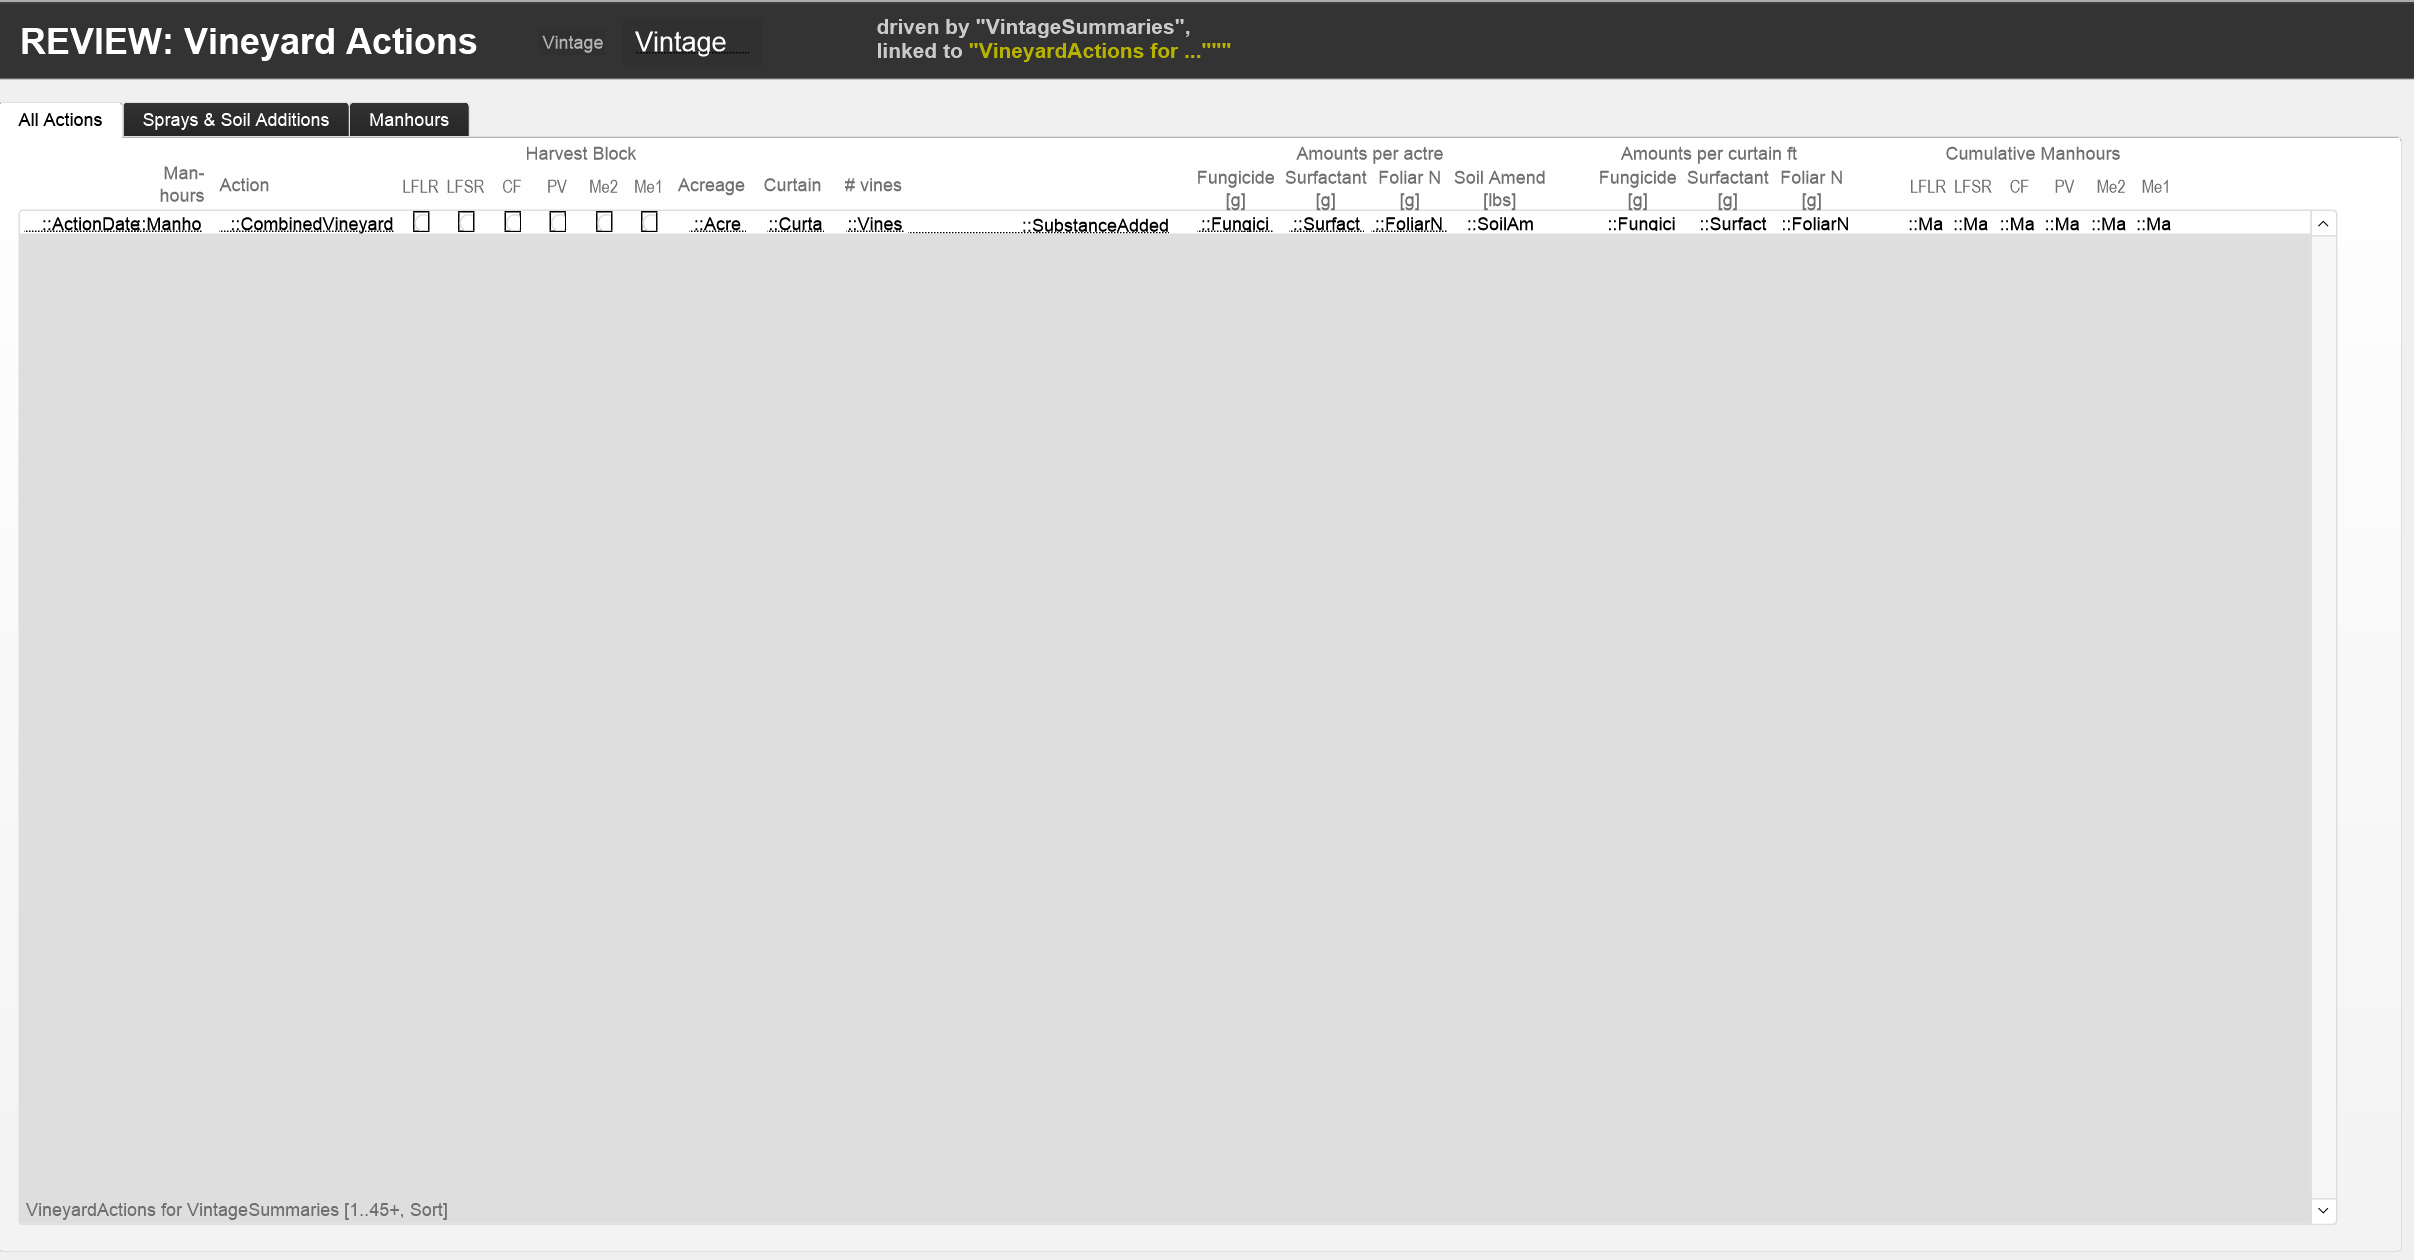
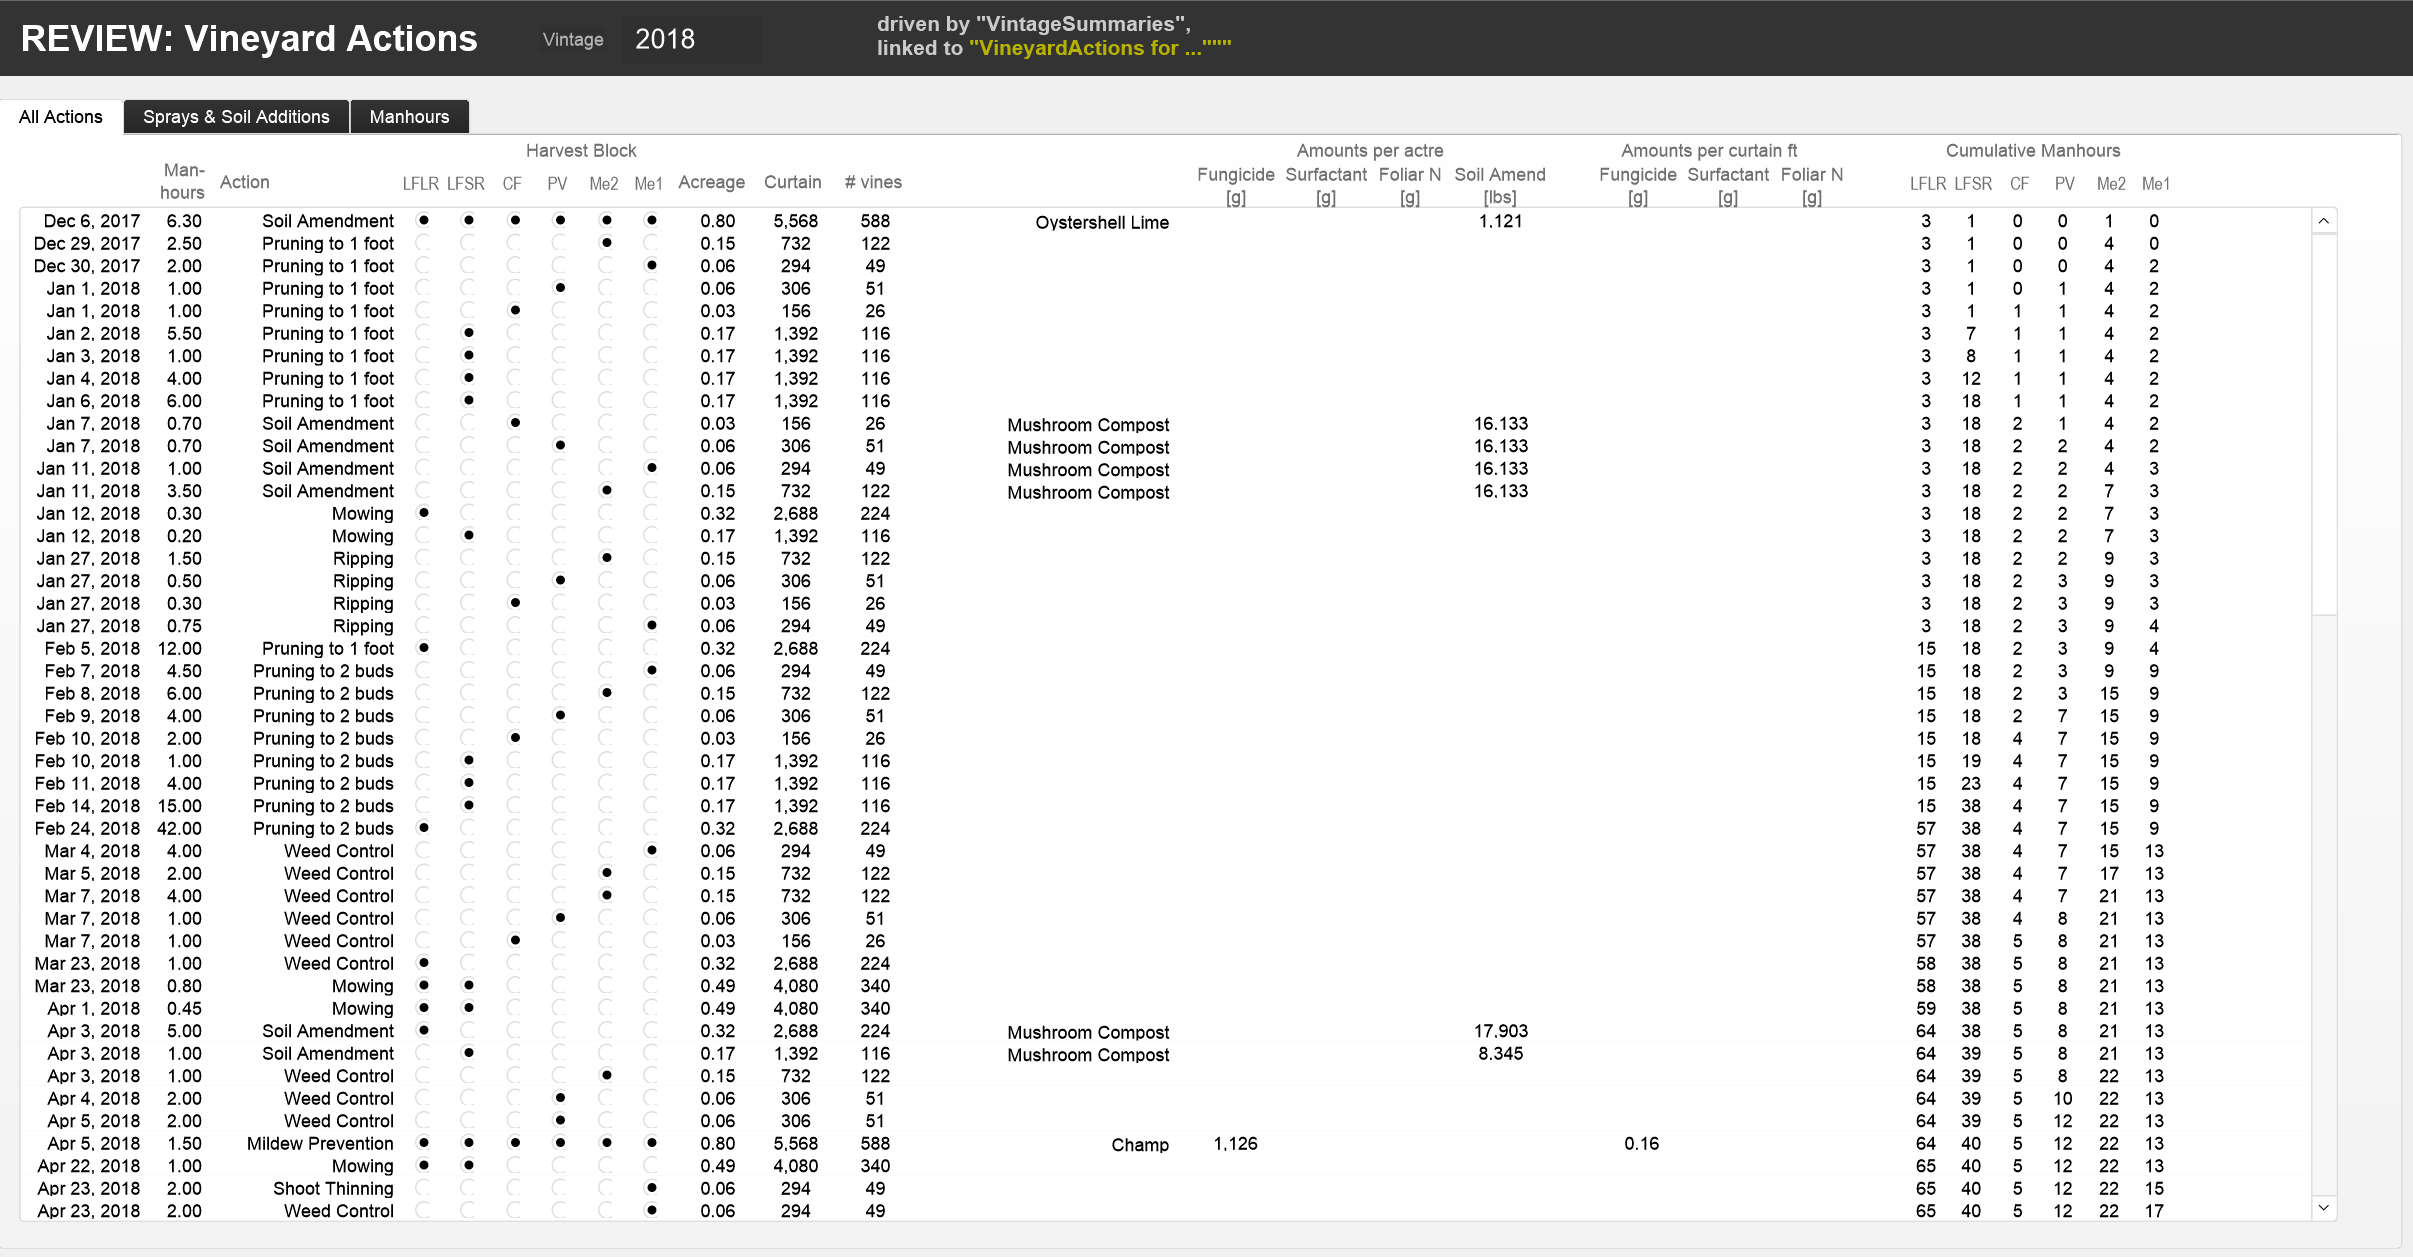
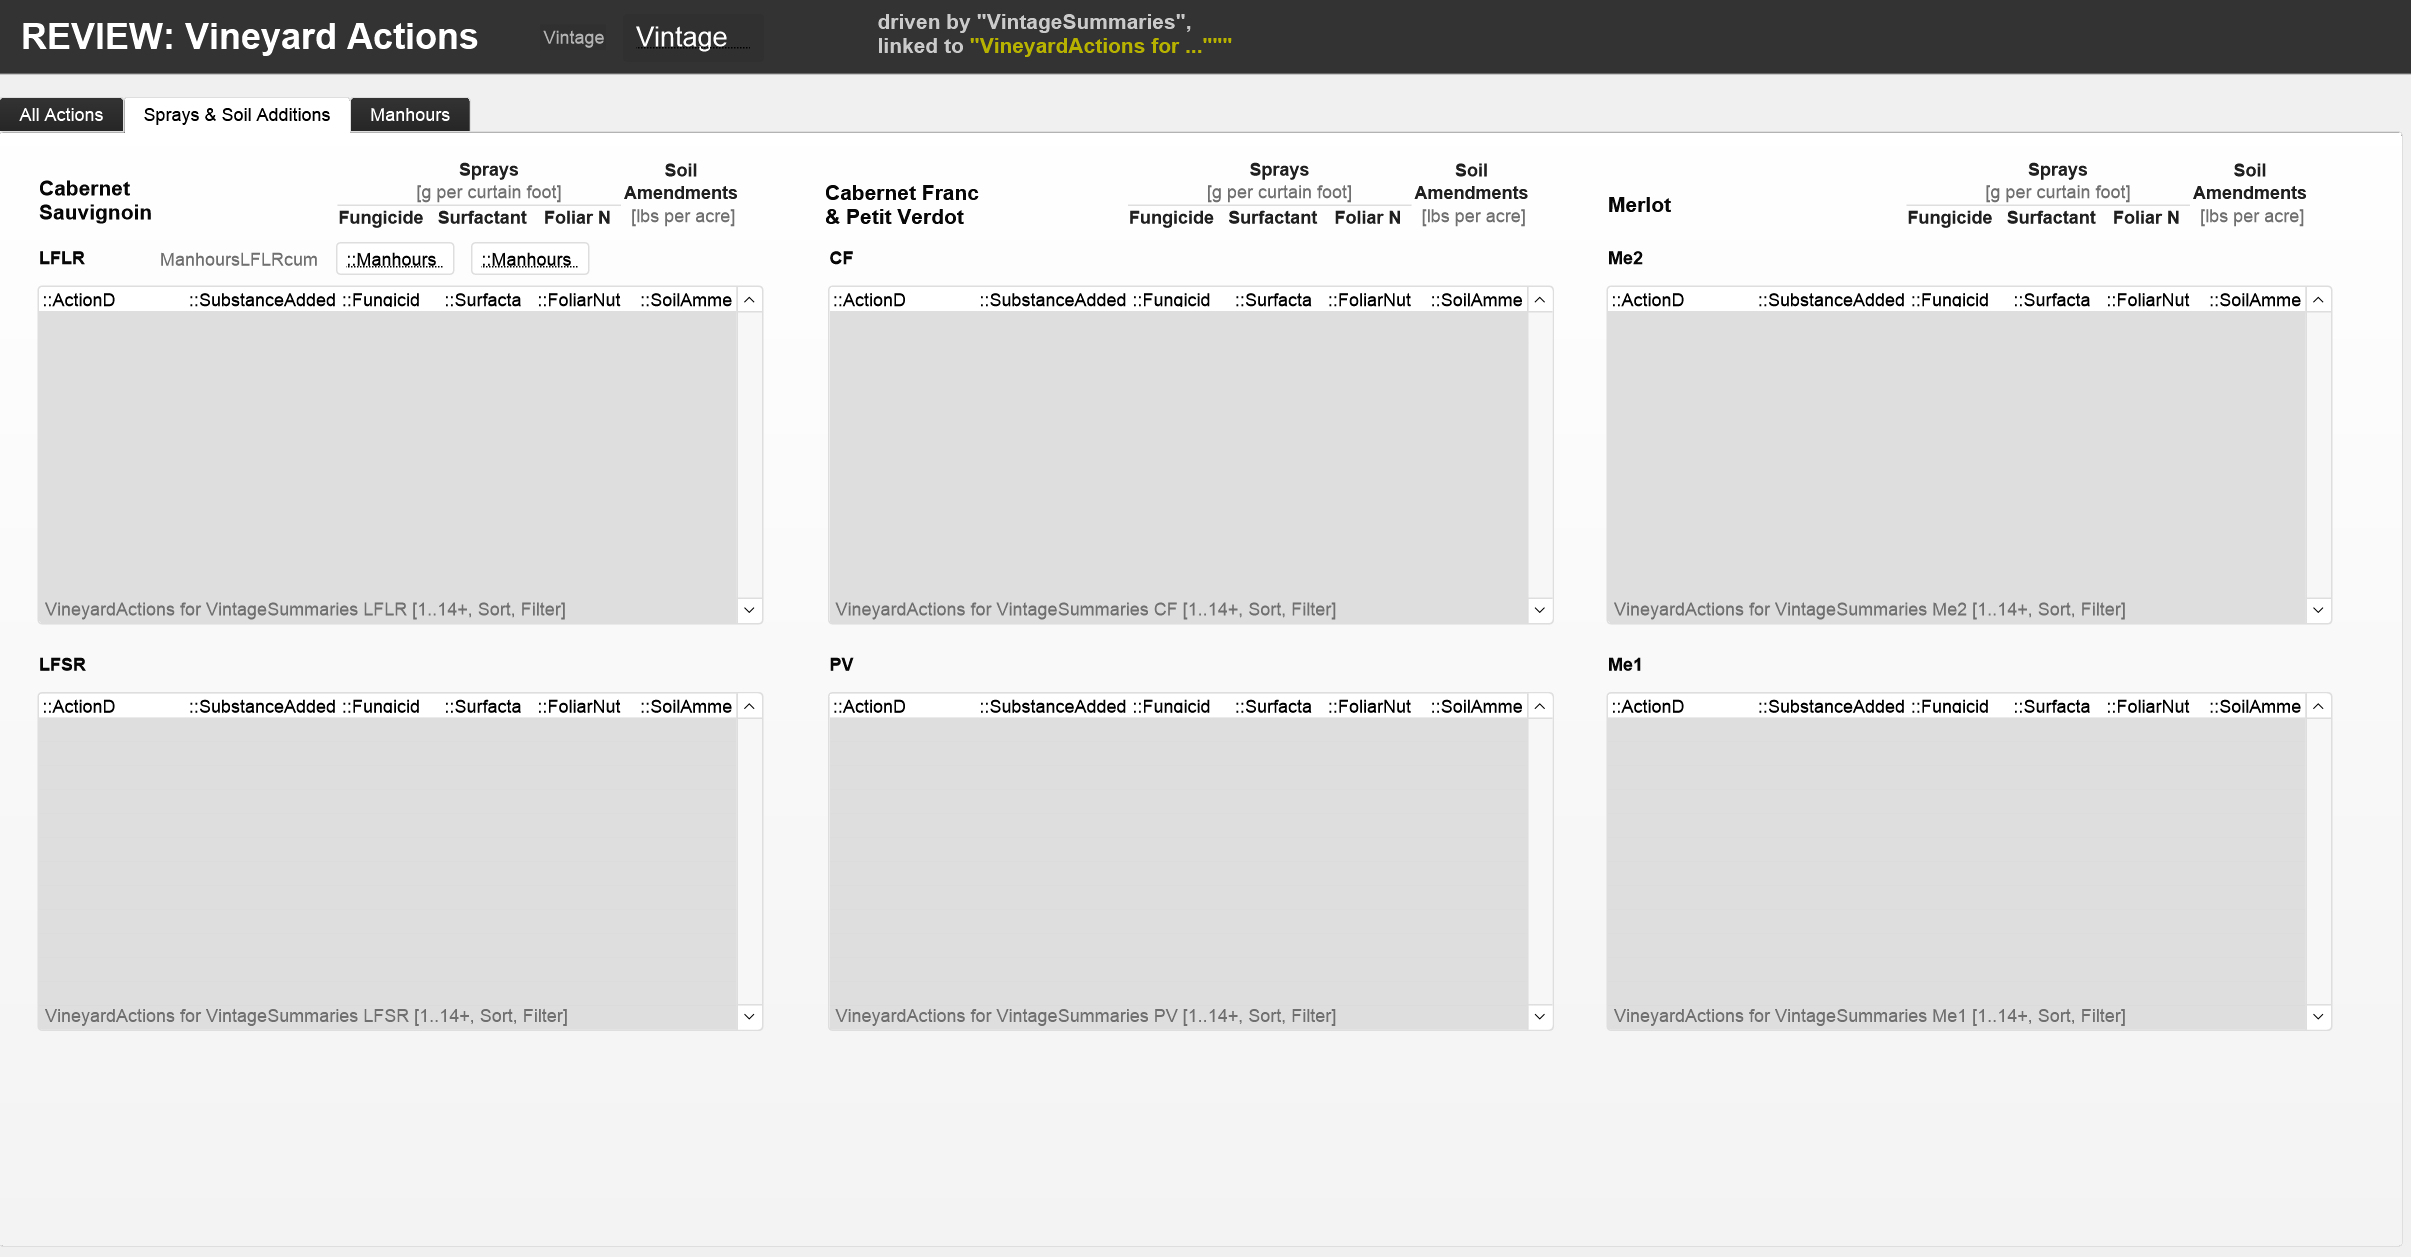
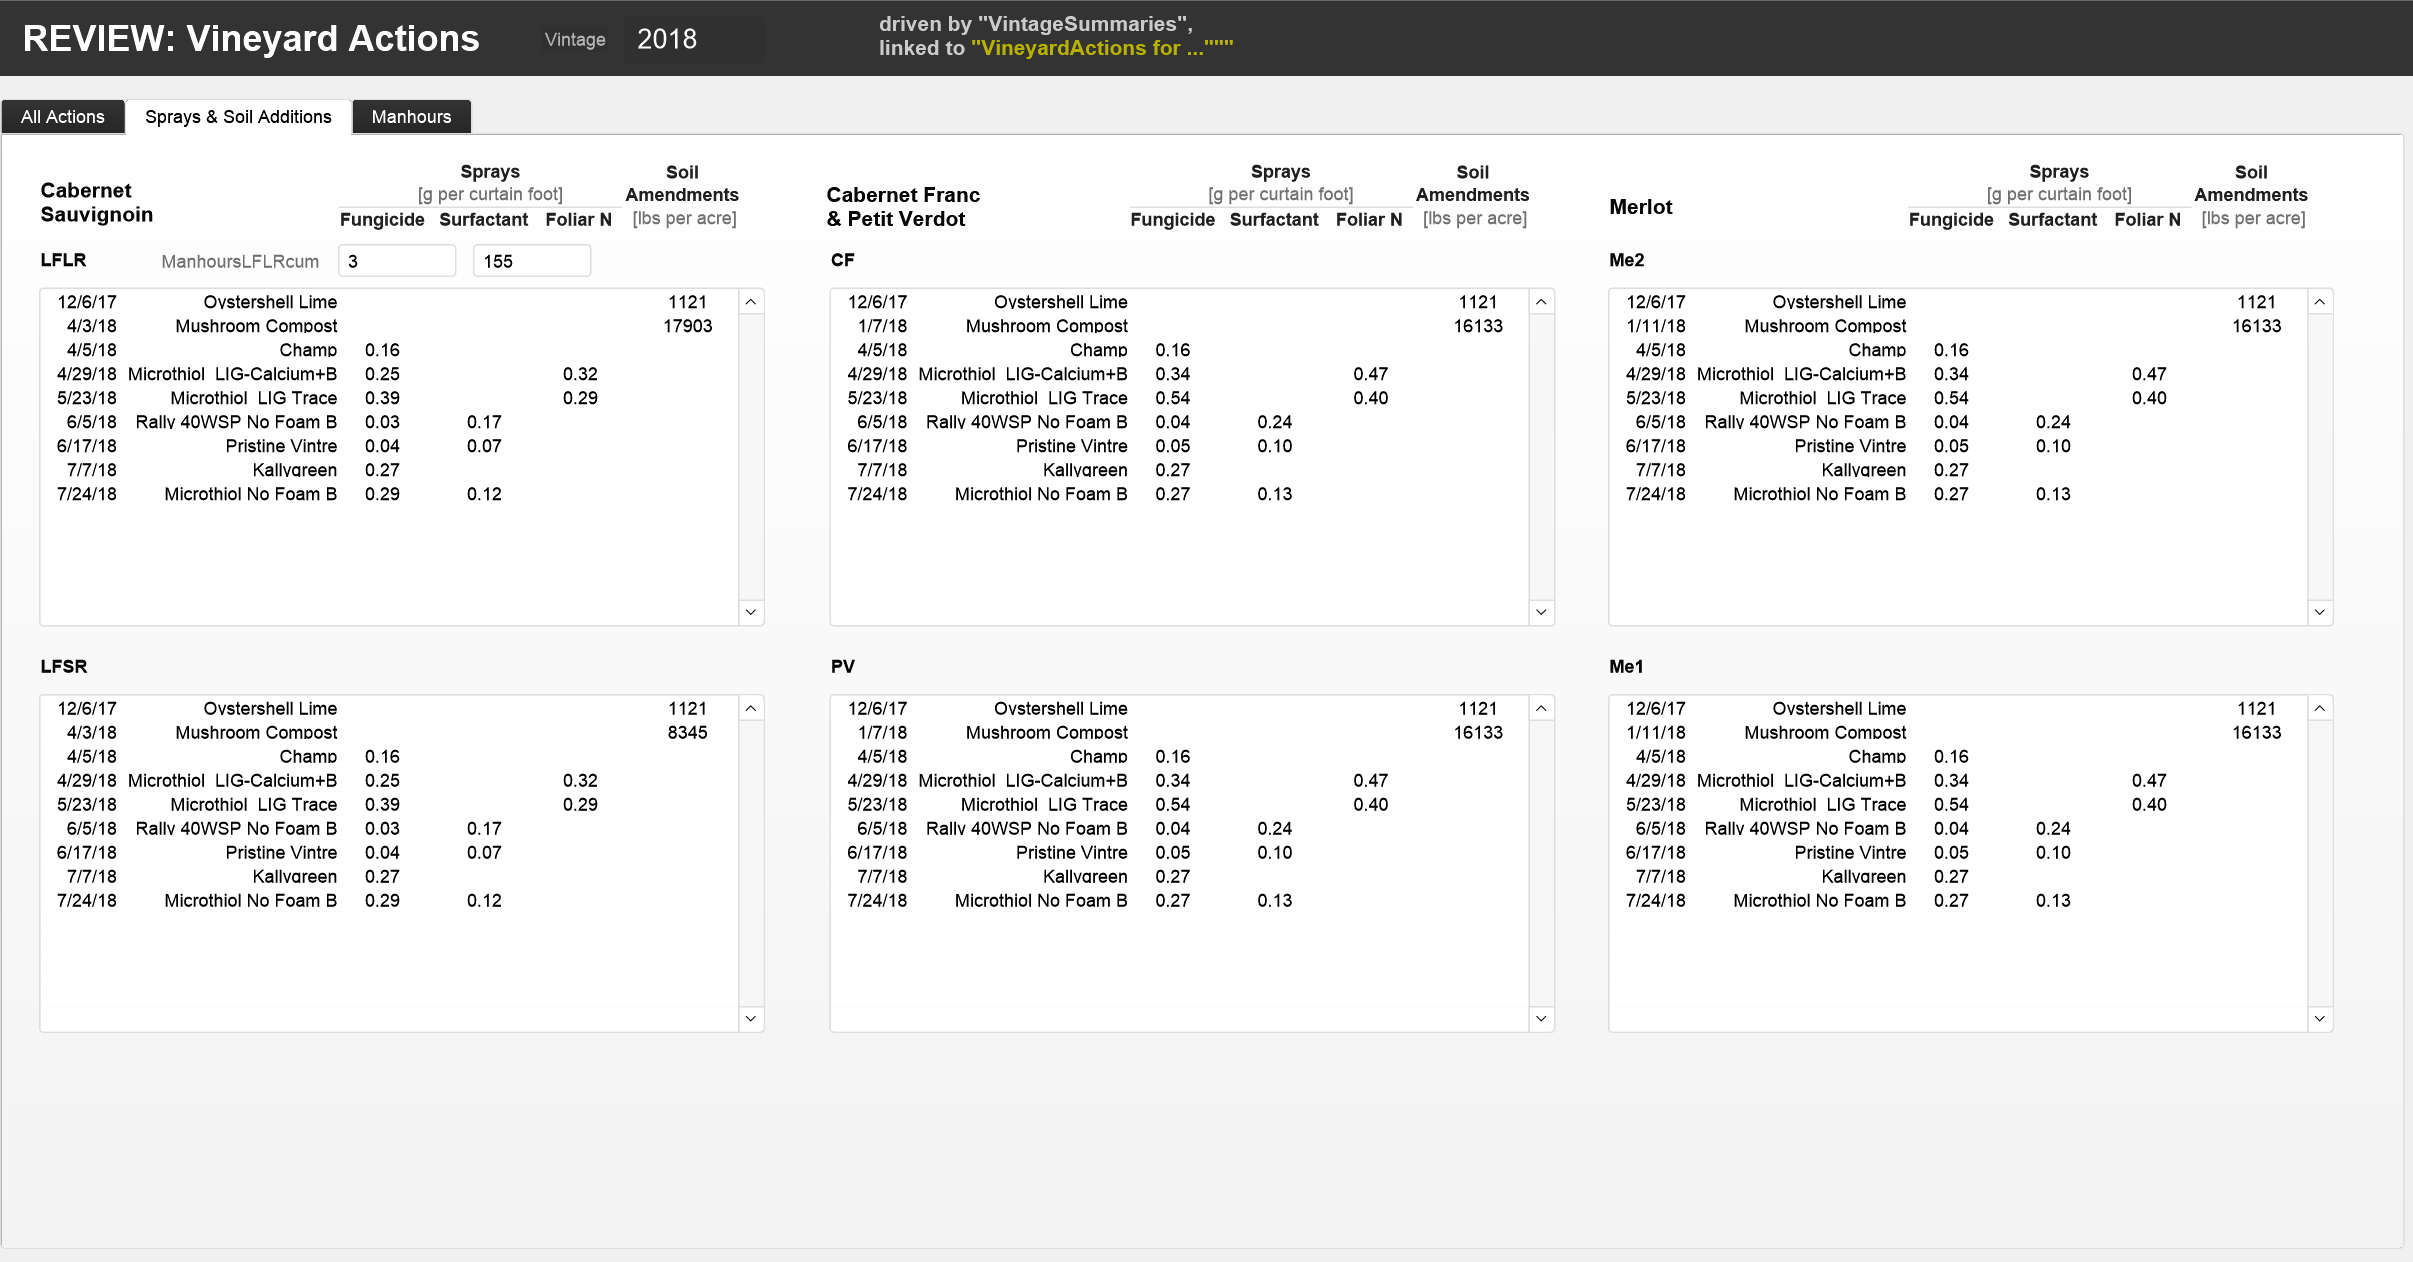
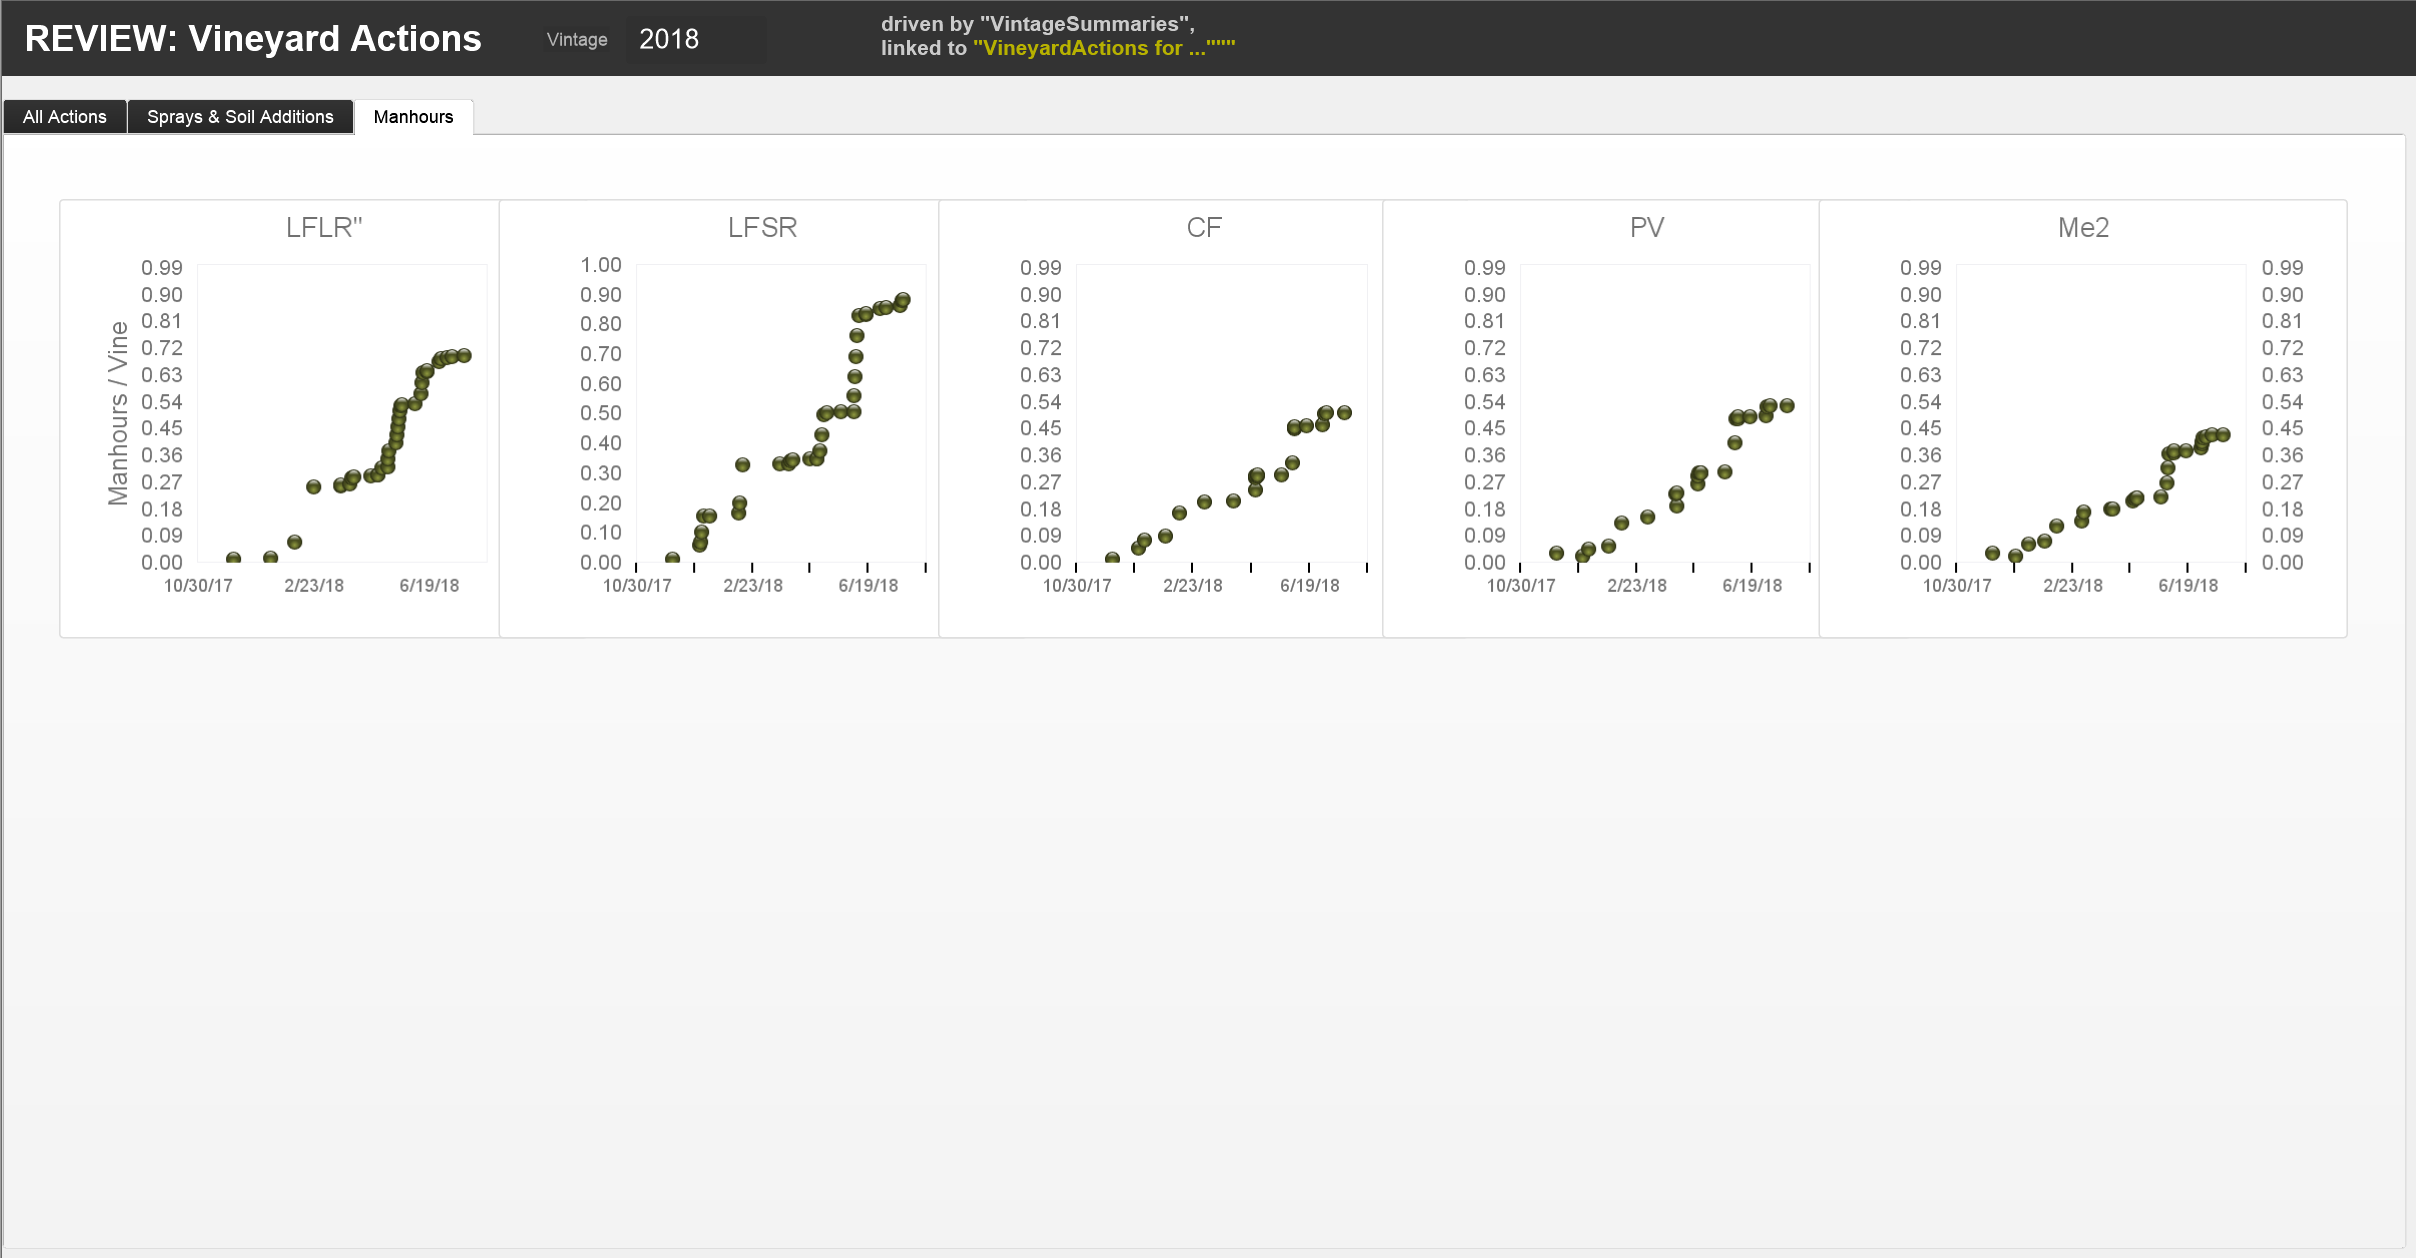
REVIEW: Vineyard Actions
The layout REVIEW: Vineyard Actions reviews all activities in the vineyard during a given year. It has 3 tabs:
- The tab “All Activities” lists all Vineyard Actions in the order of time and shows accumulated man-hours recorded by block
- The tab “Sprays & Soil Additions” provides, by block, a listing of all soil amendments and pesticide & nutrient sprays in order of time applied.
- The tab “Manhours” shows, for each block, a graph of accumulated manhours.
The following screenshots show the layout’s three tabs with field names and with data from 2018.

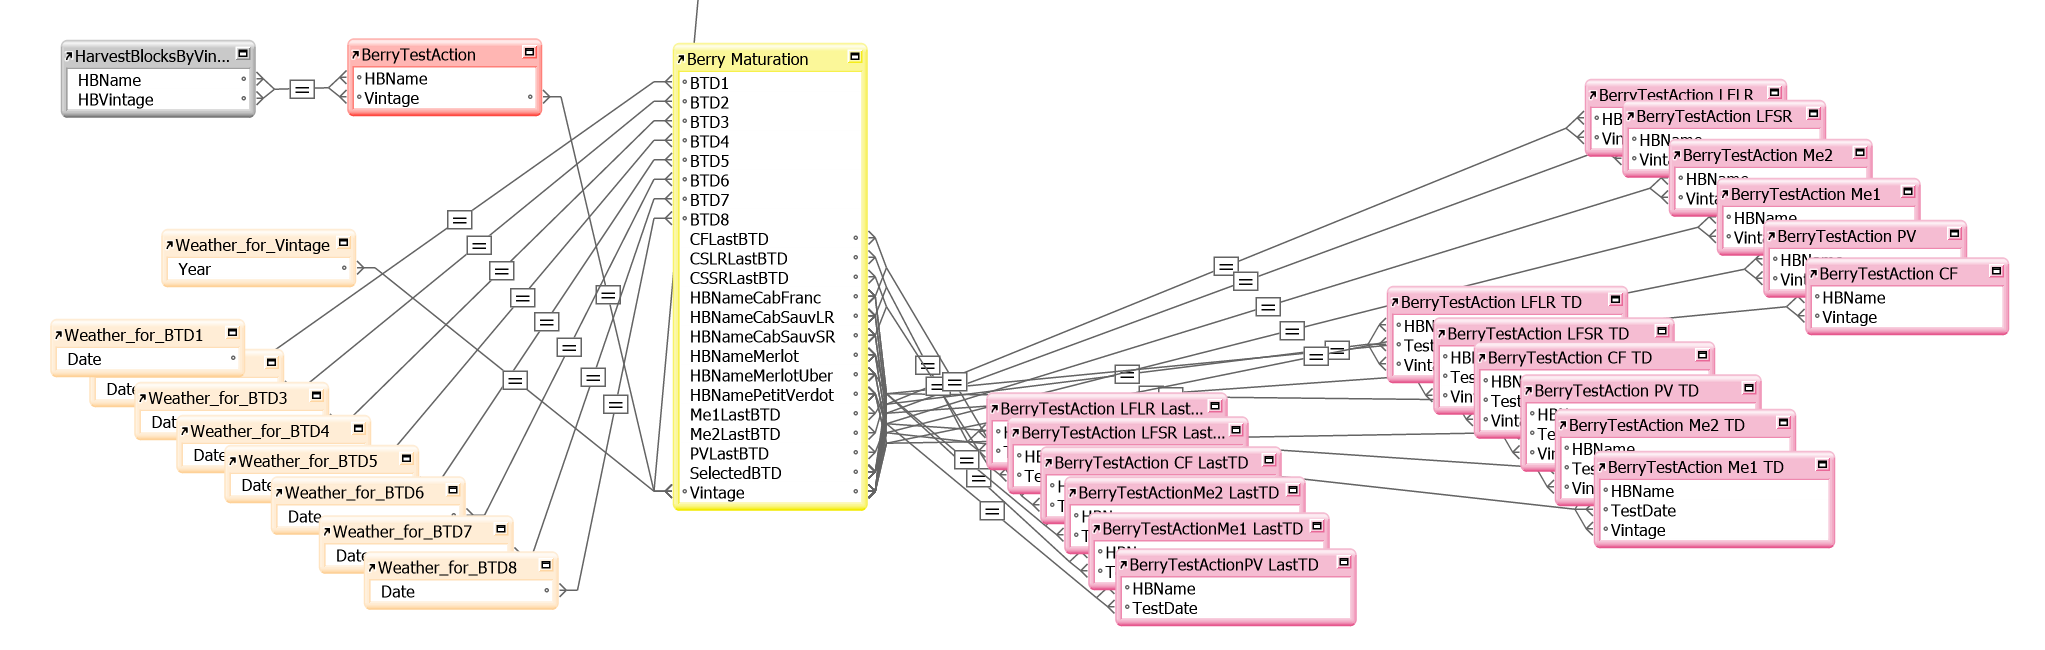
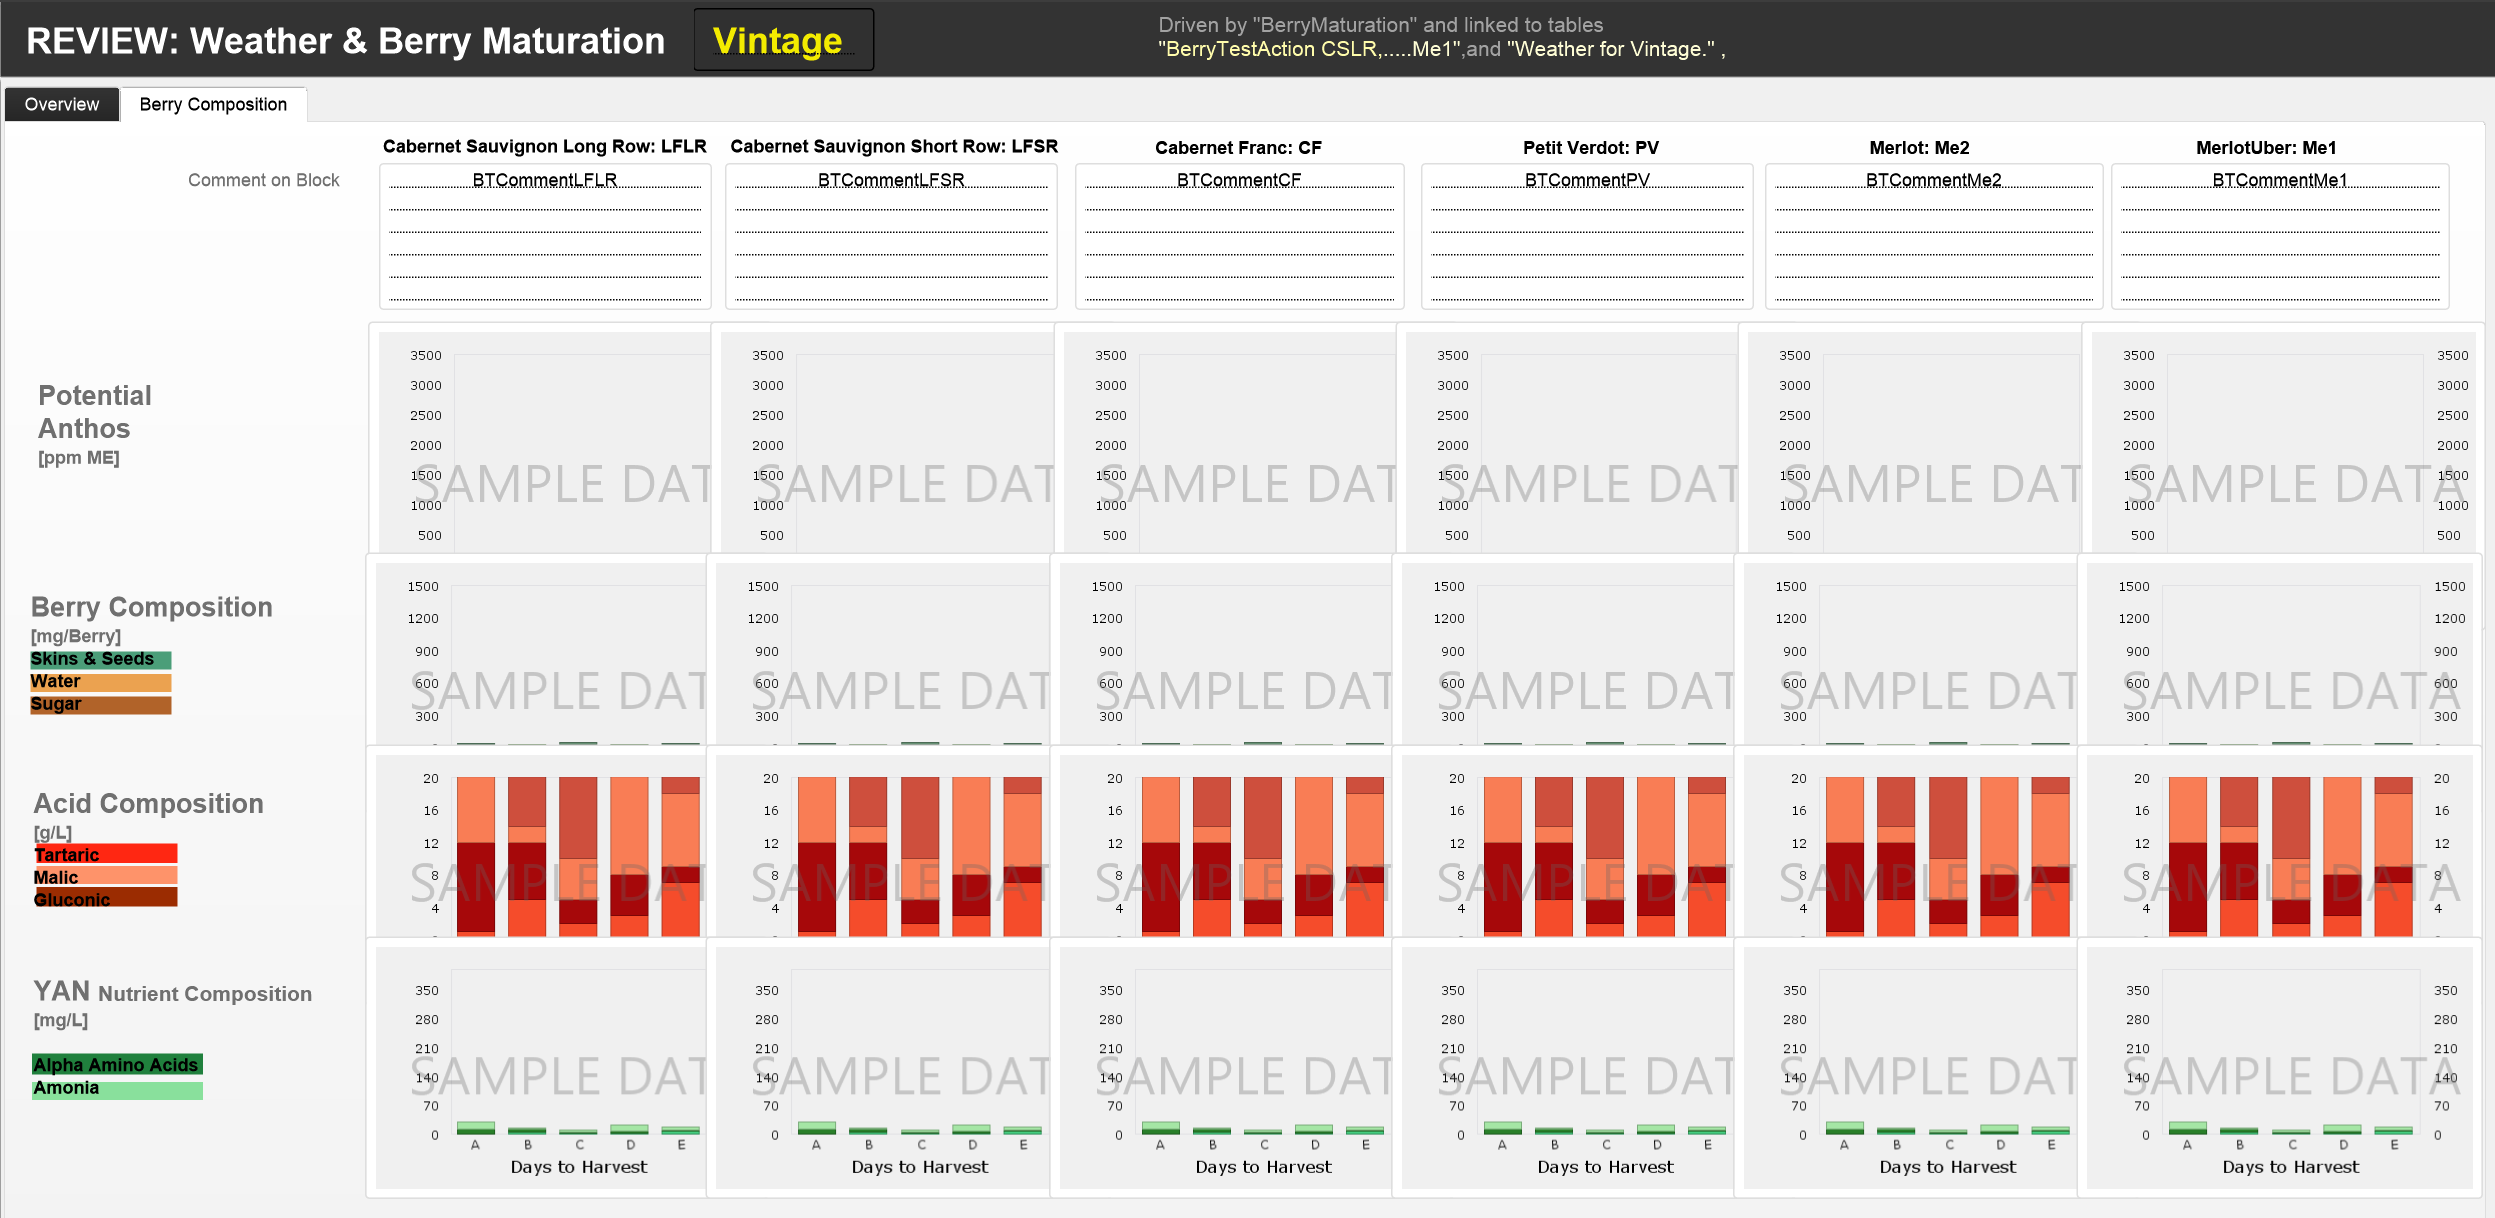
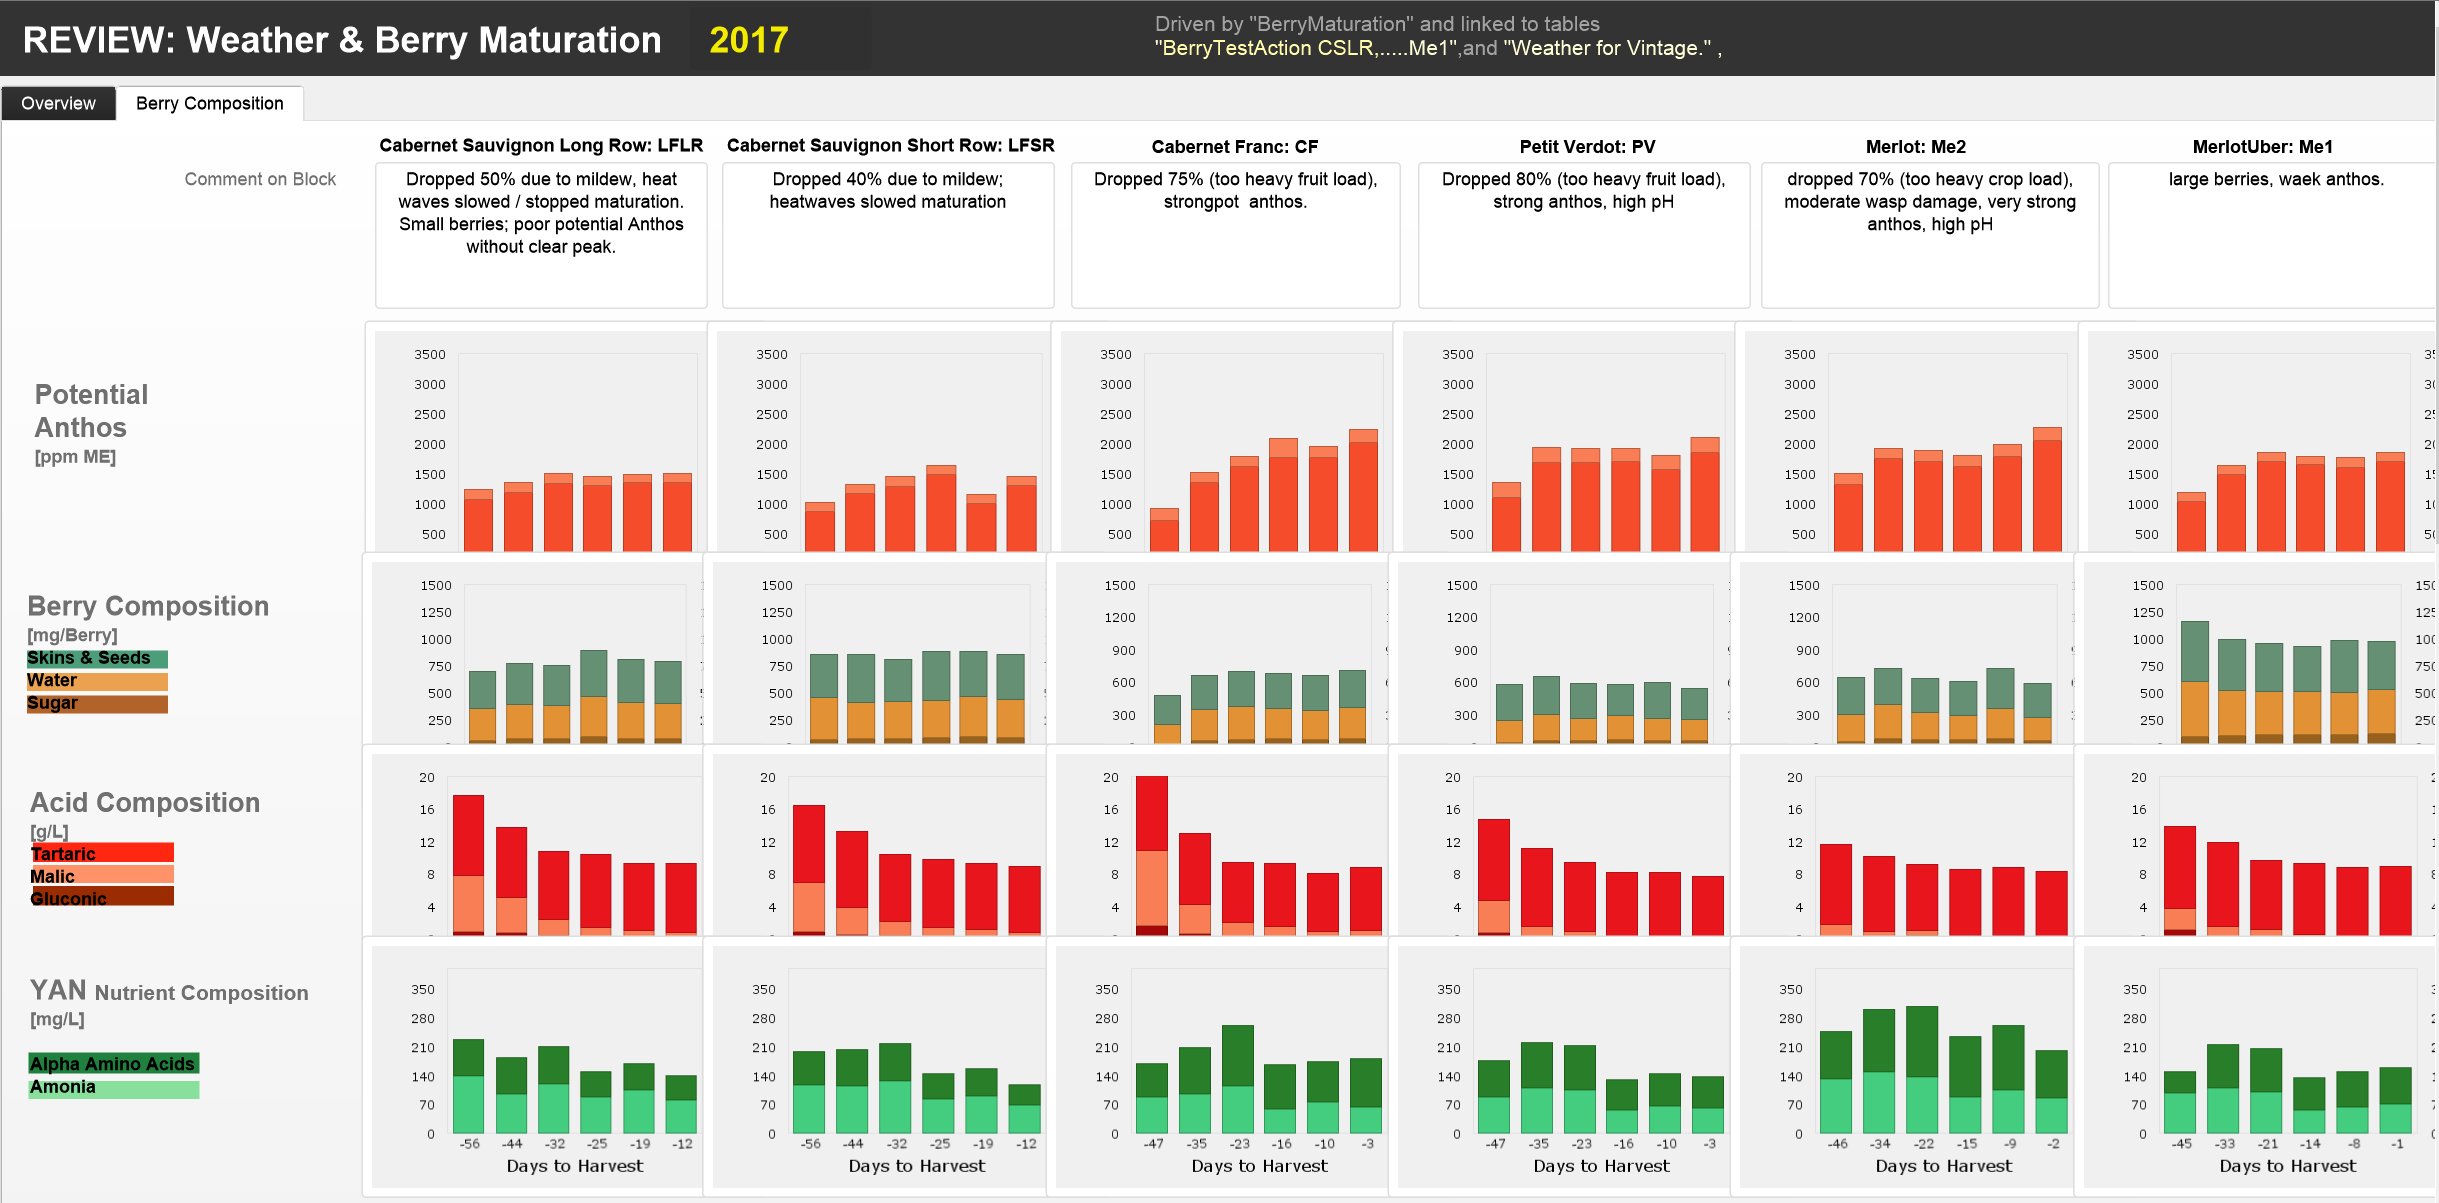
REVIEW: Weather & Berry Maturation
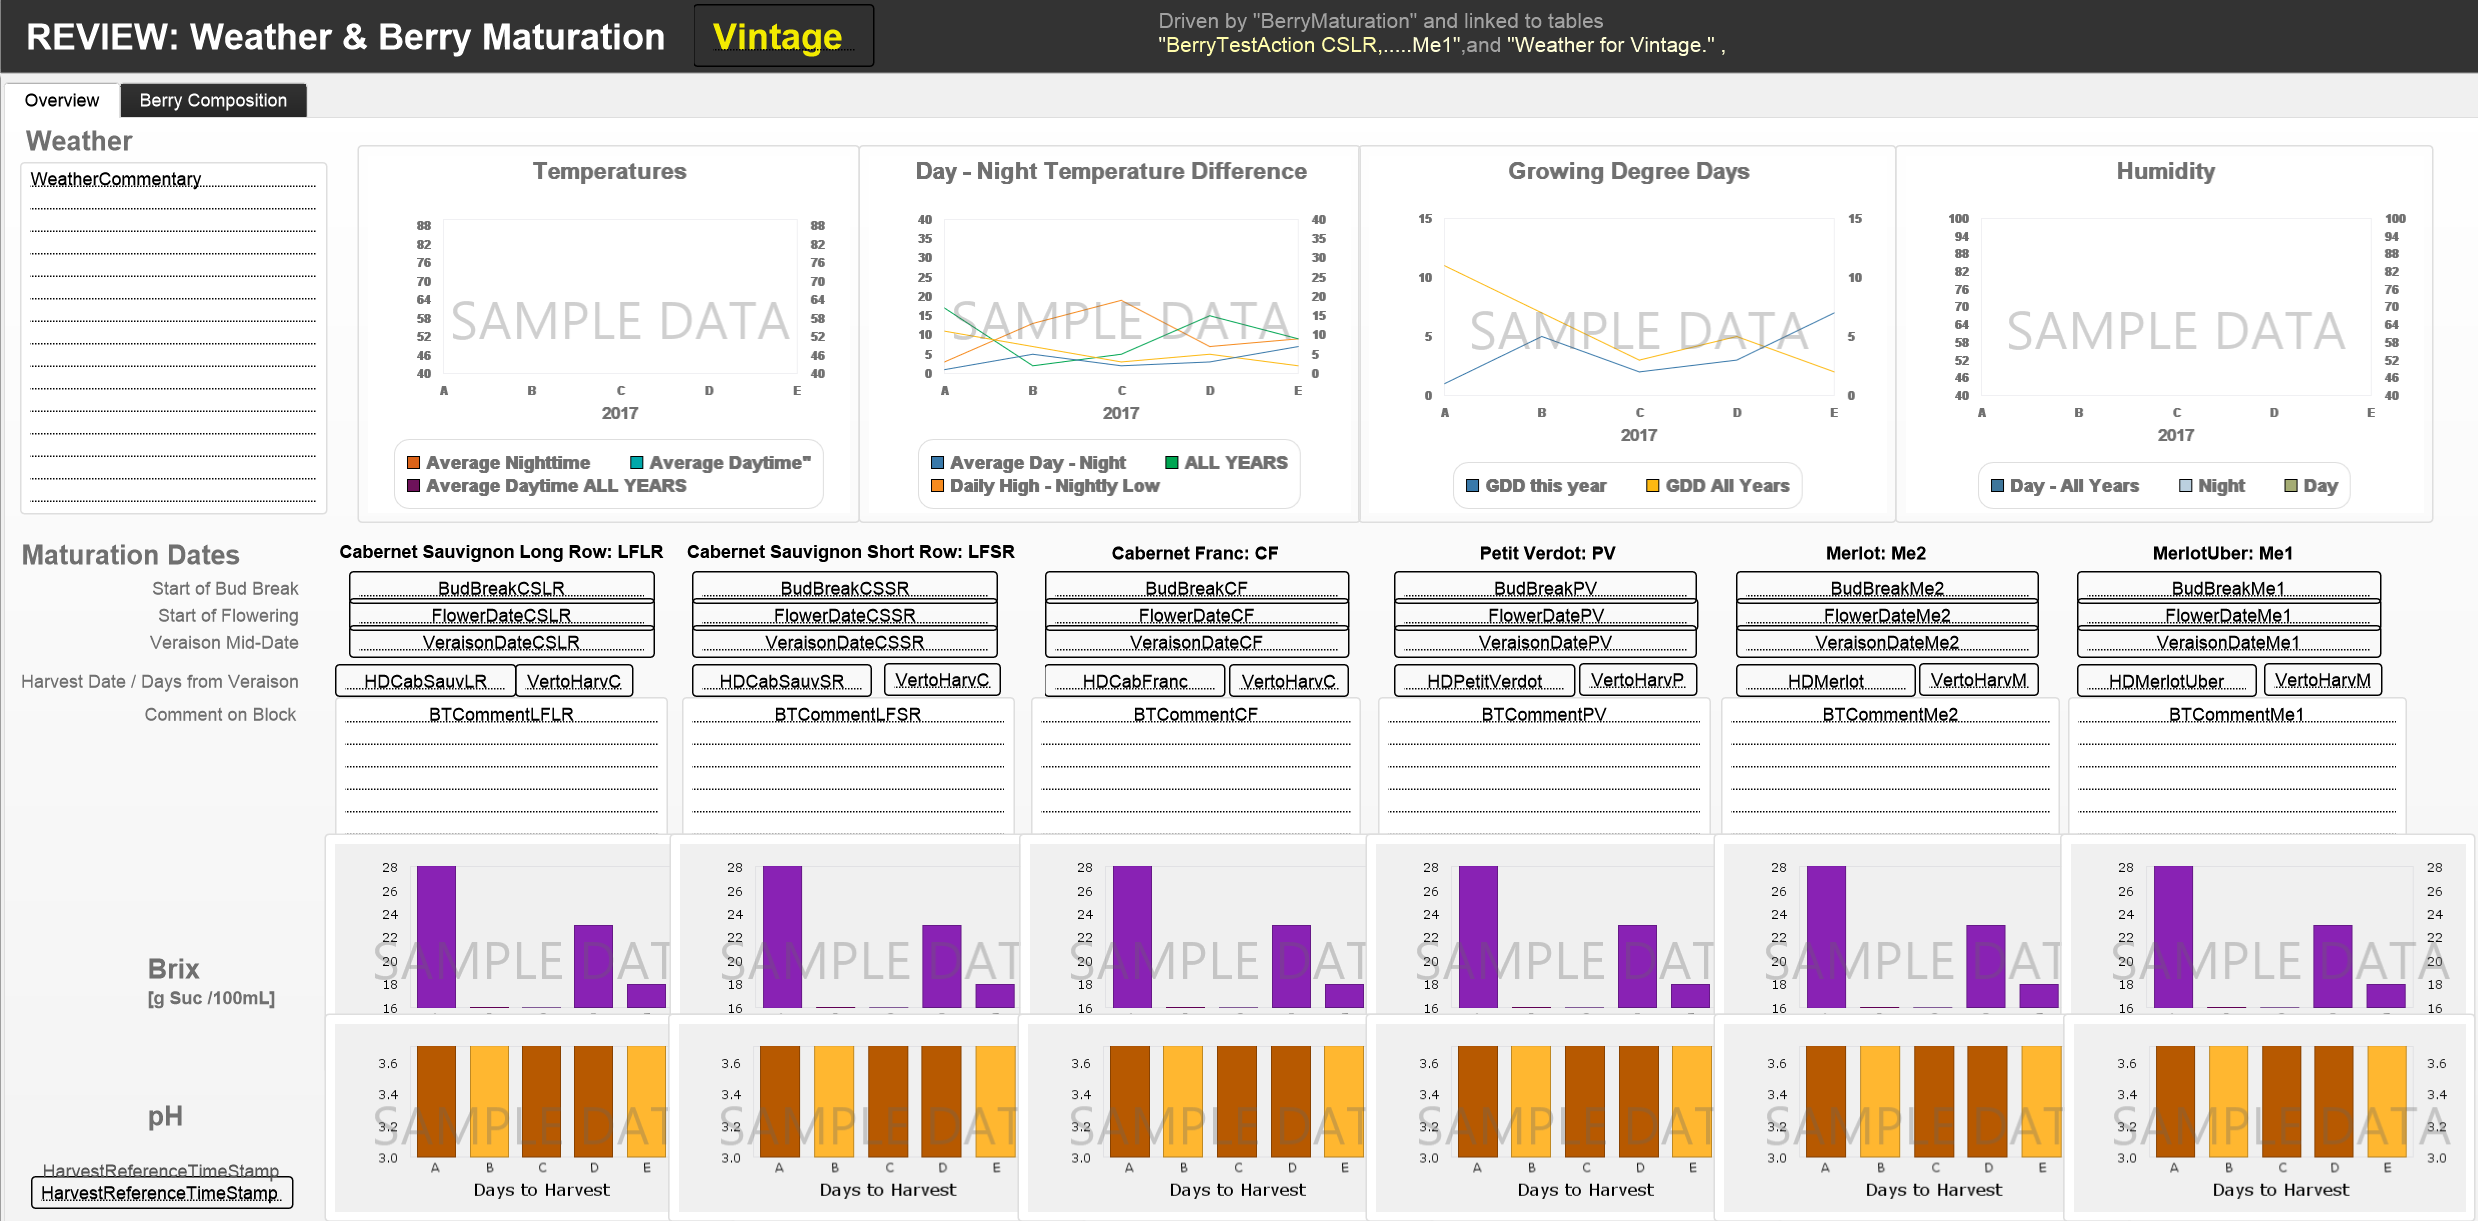
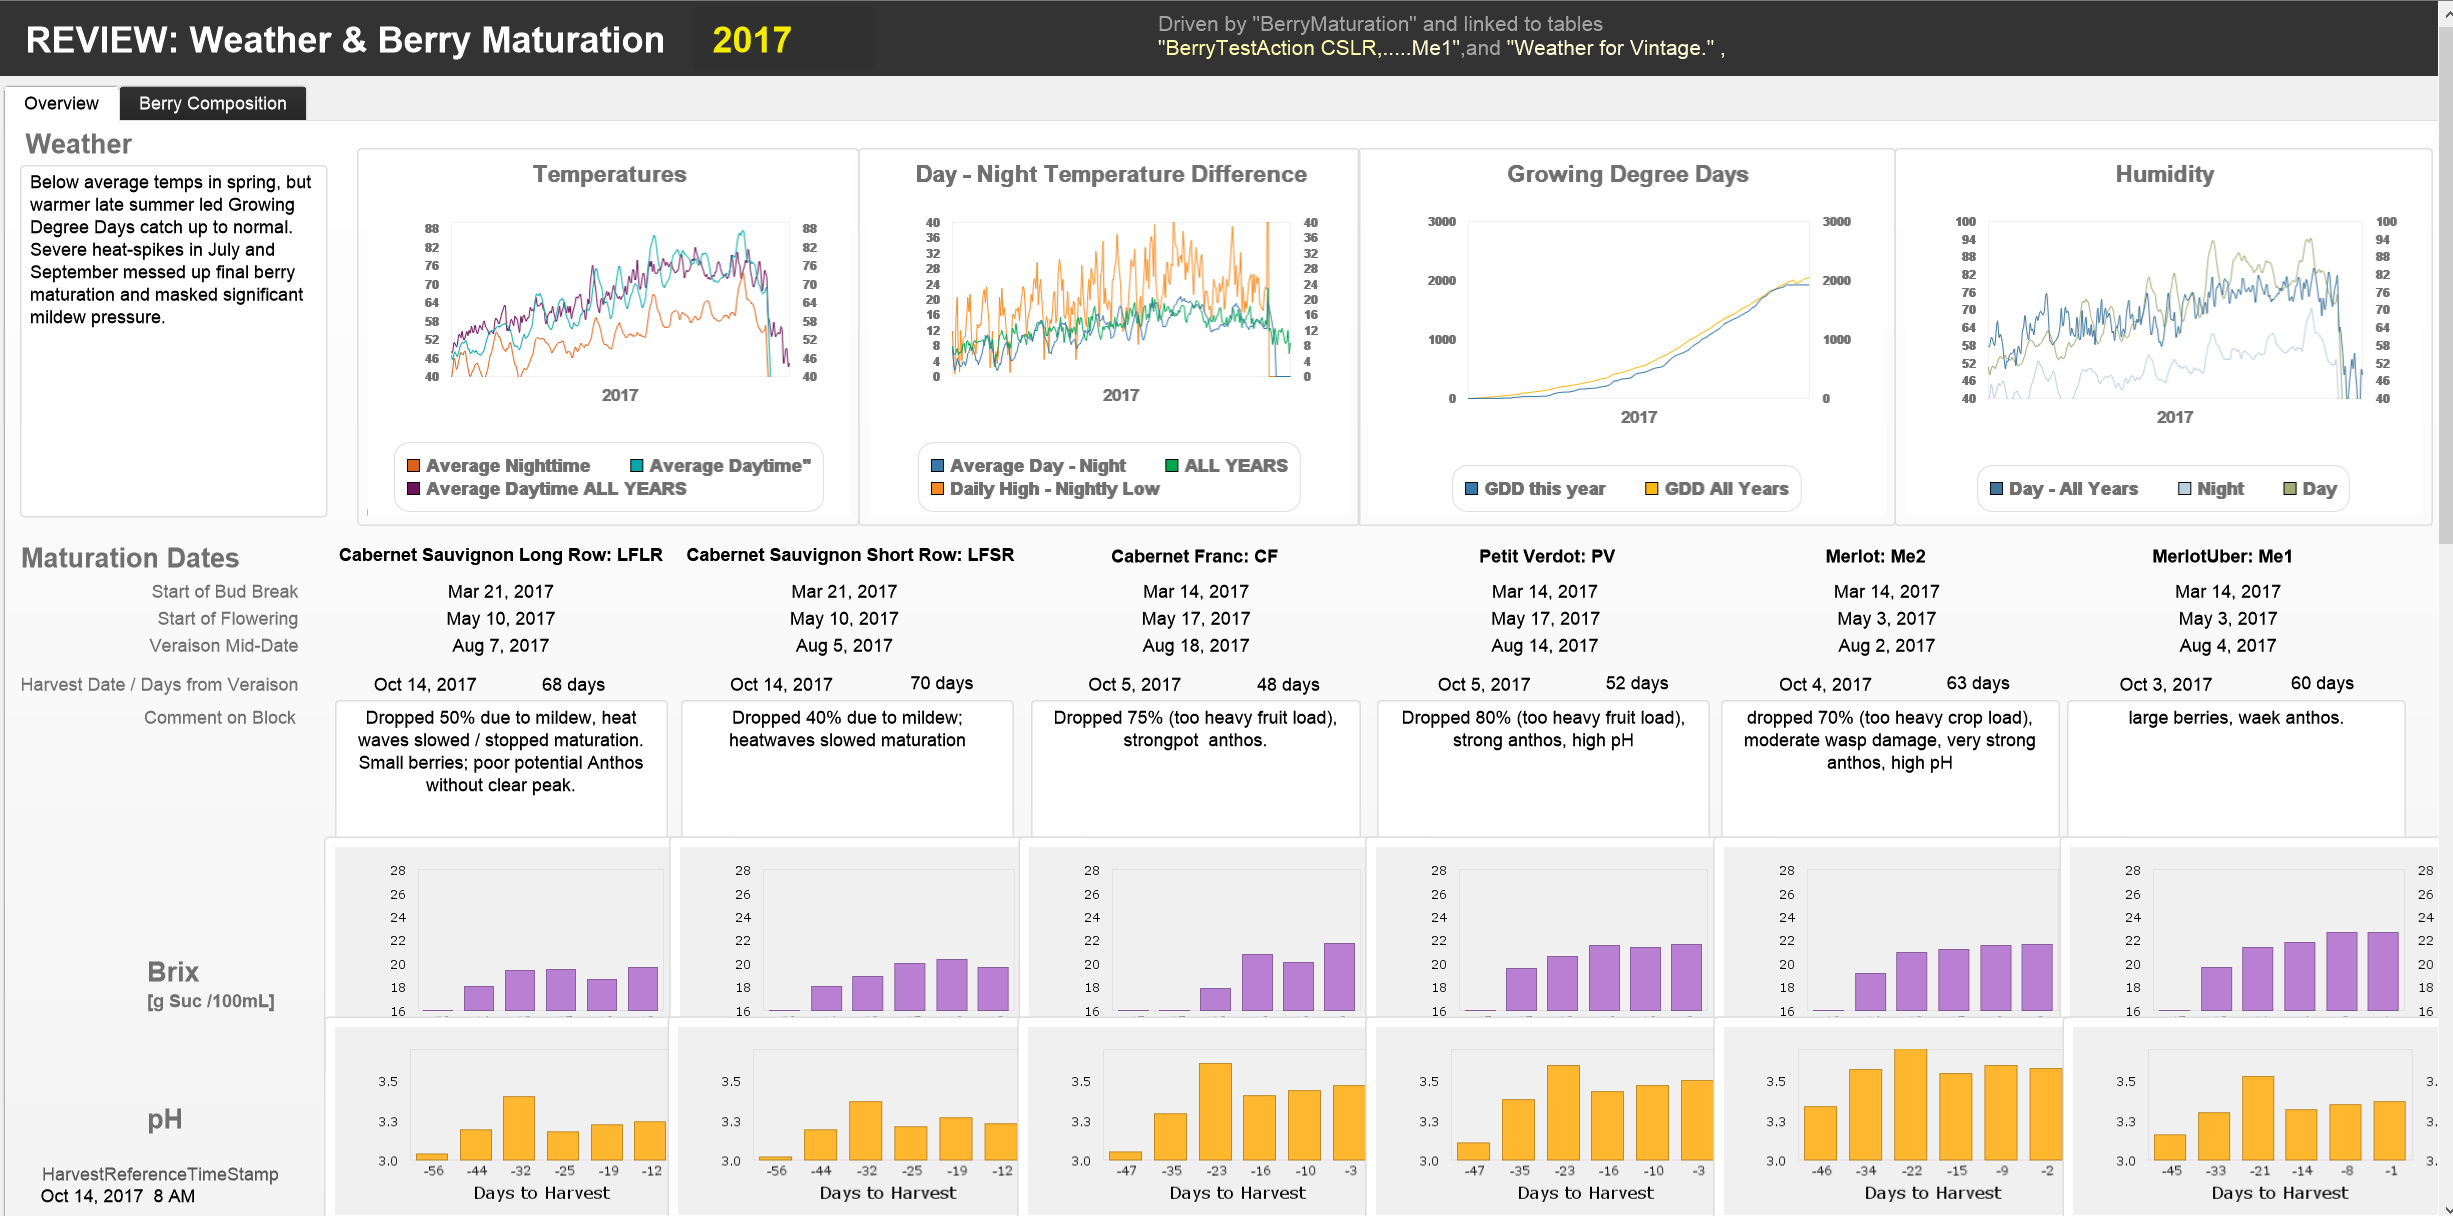
The layout “REVIEW: Weather & Berry Maturation” shows, for each year, the weather pattern and how the berries matured in each block. We use it to record weather and maturation commentaries right before harvest to help to make fermentation decisions. The layout has two tabs:
- The Overview tab shows weather conditions during the year, key maturation dates and Brix and pH charts for each block
- The Berry Maturation tab shows charts on the evolution of berry maturation per block.
The layout is driven by an instance of the BerryMaturation table which links to multiple instances of the Weather and the BerryTestAction tables as shown in the following graphic:
The following screenshots show, for each tab, the layouts with field names and, for example, the data for 2017 with commentaries:
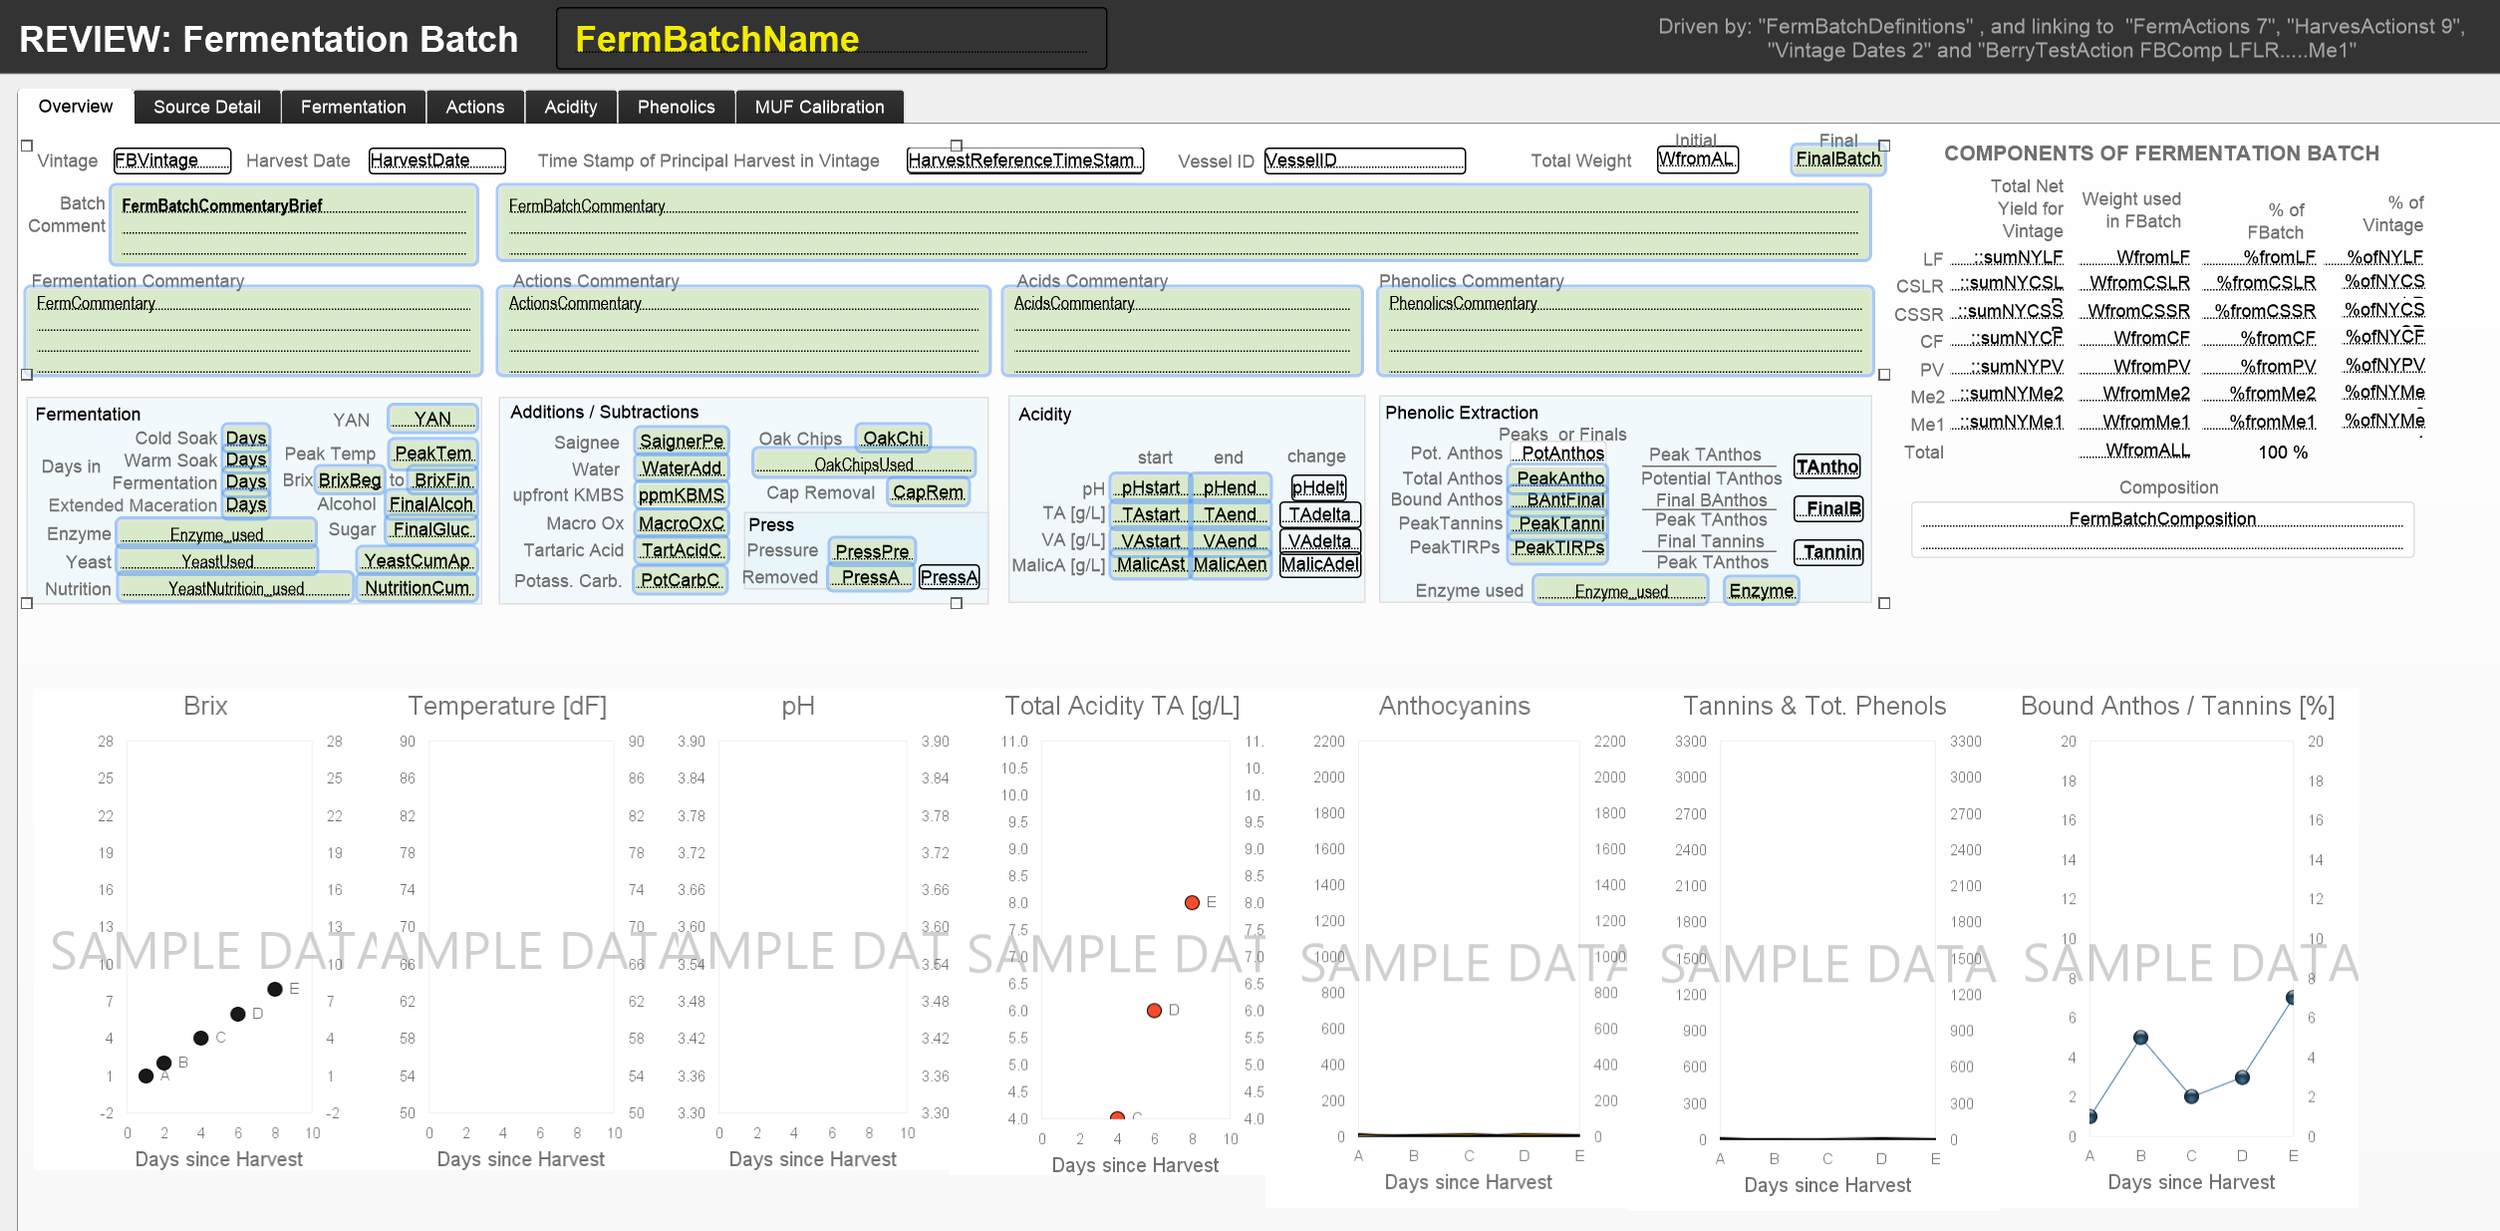
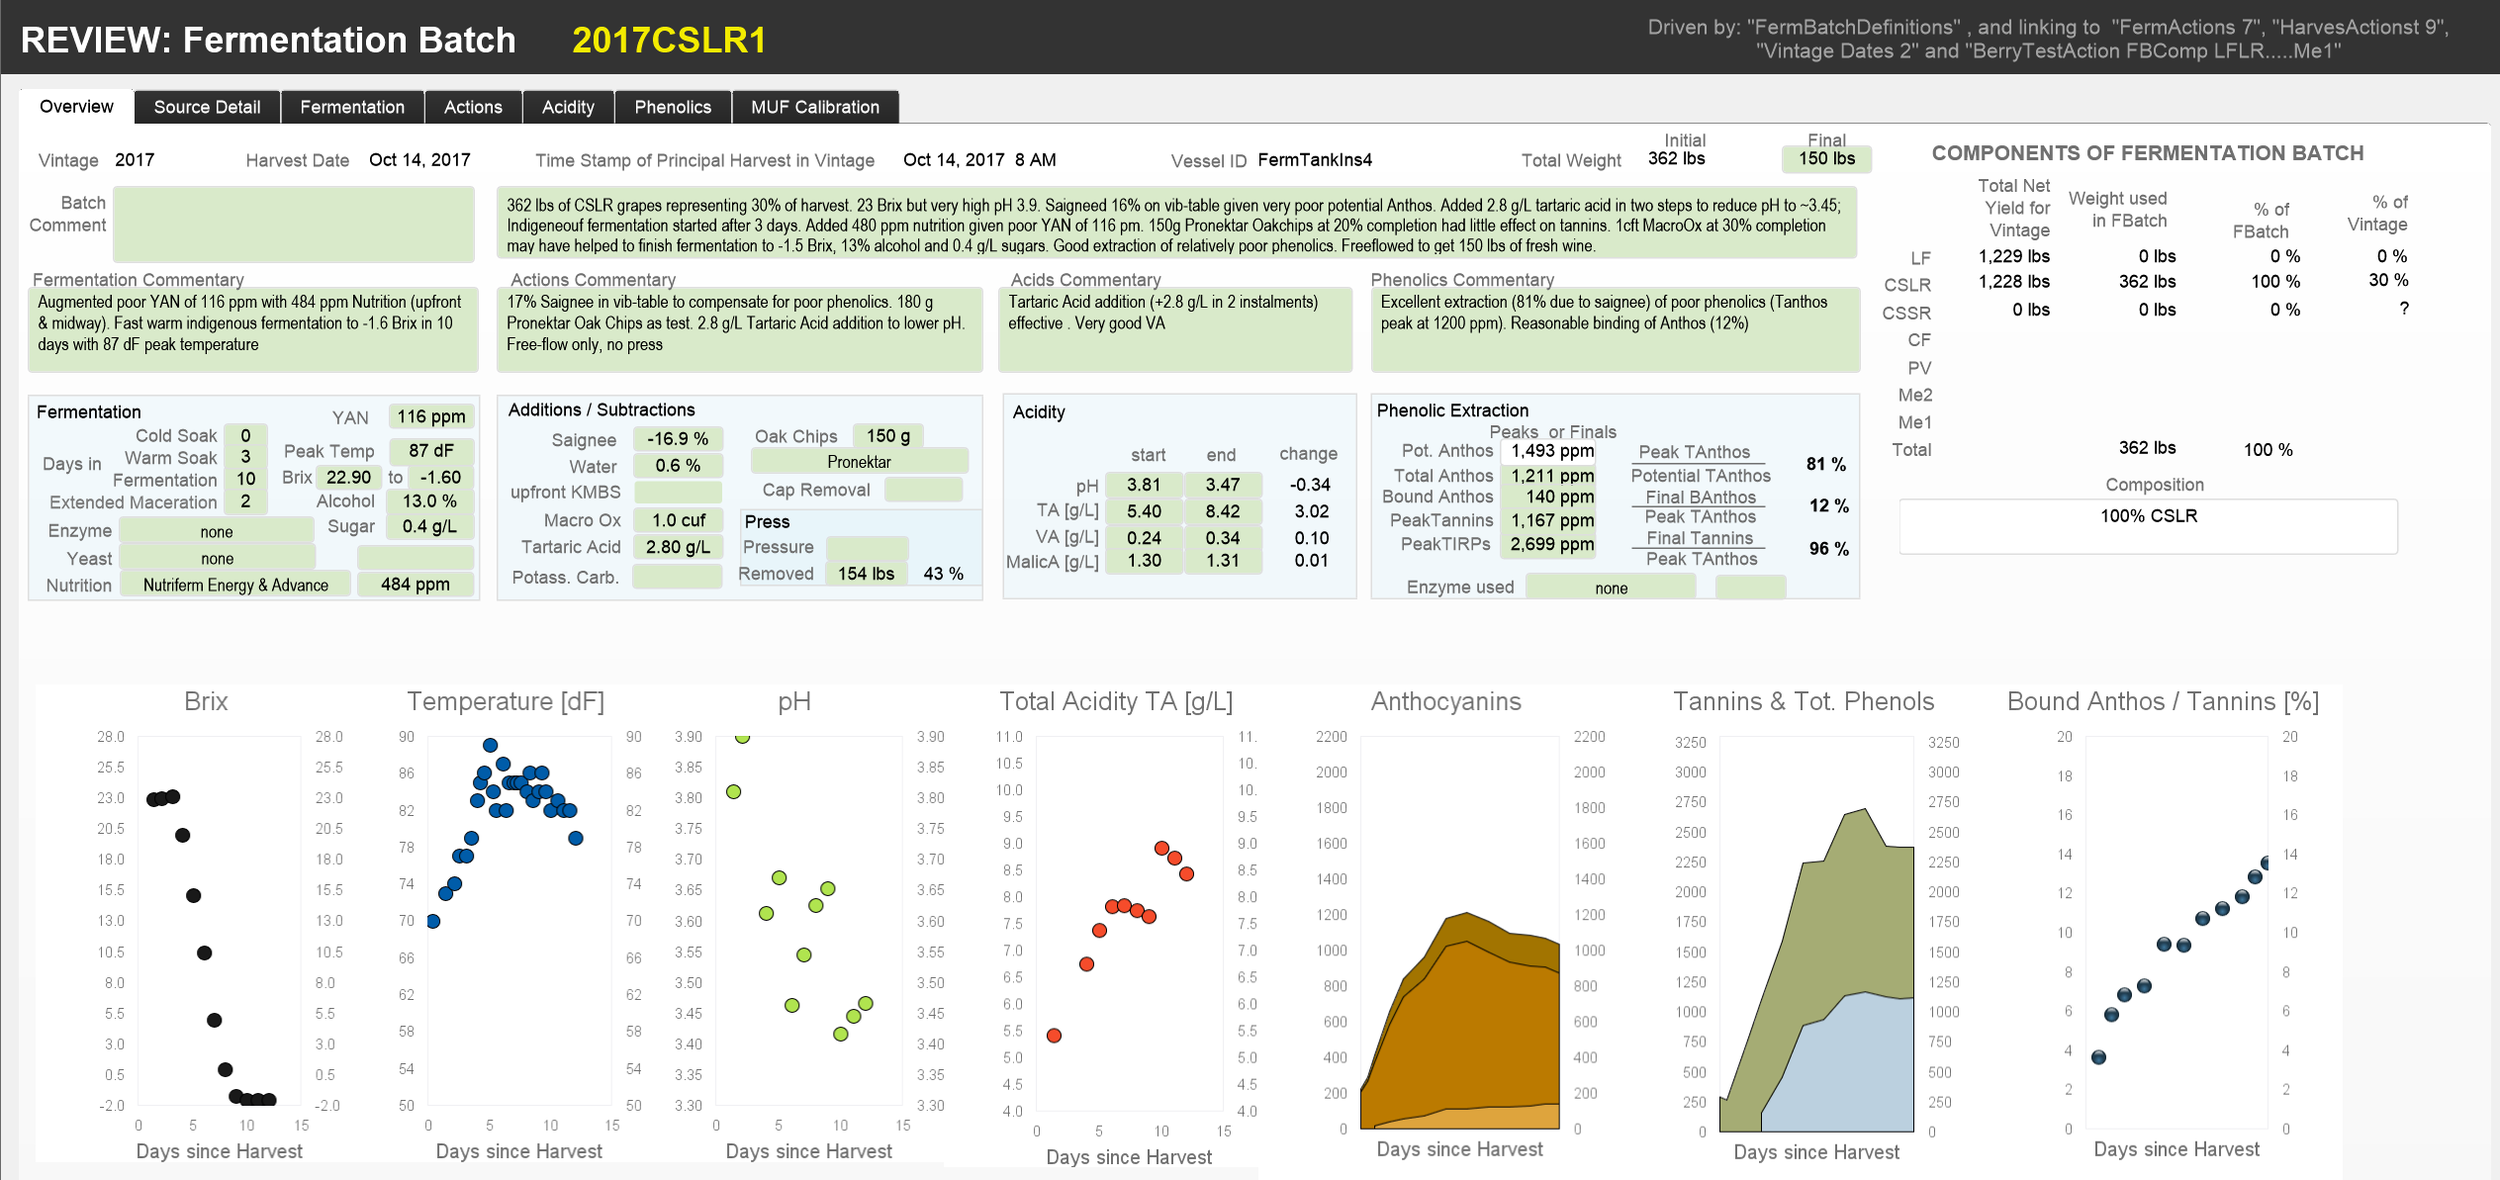
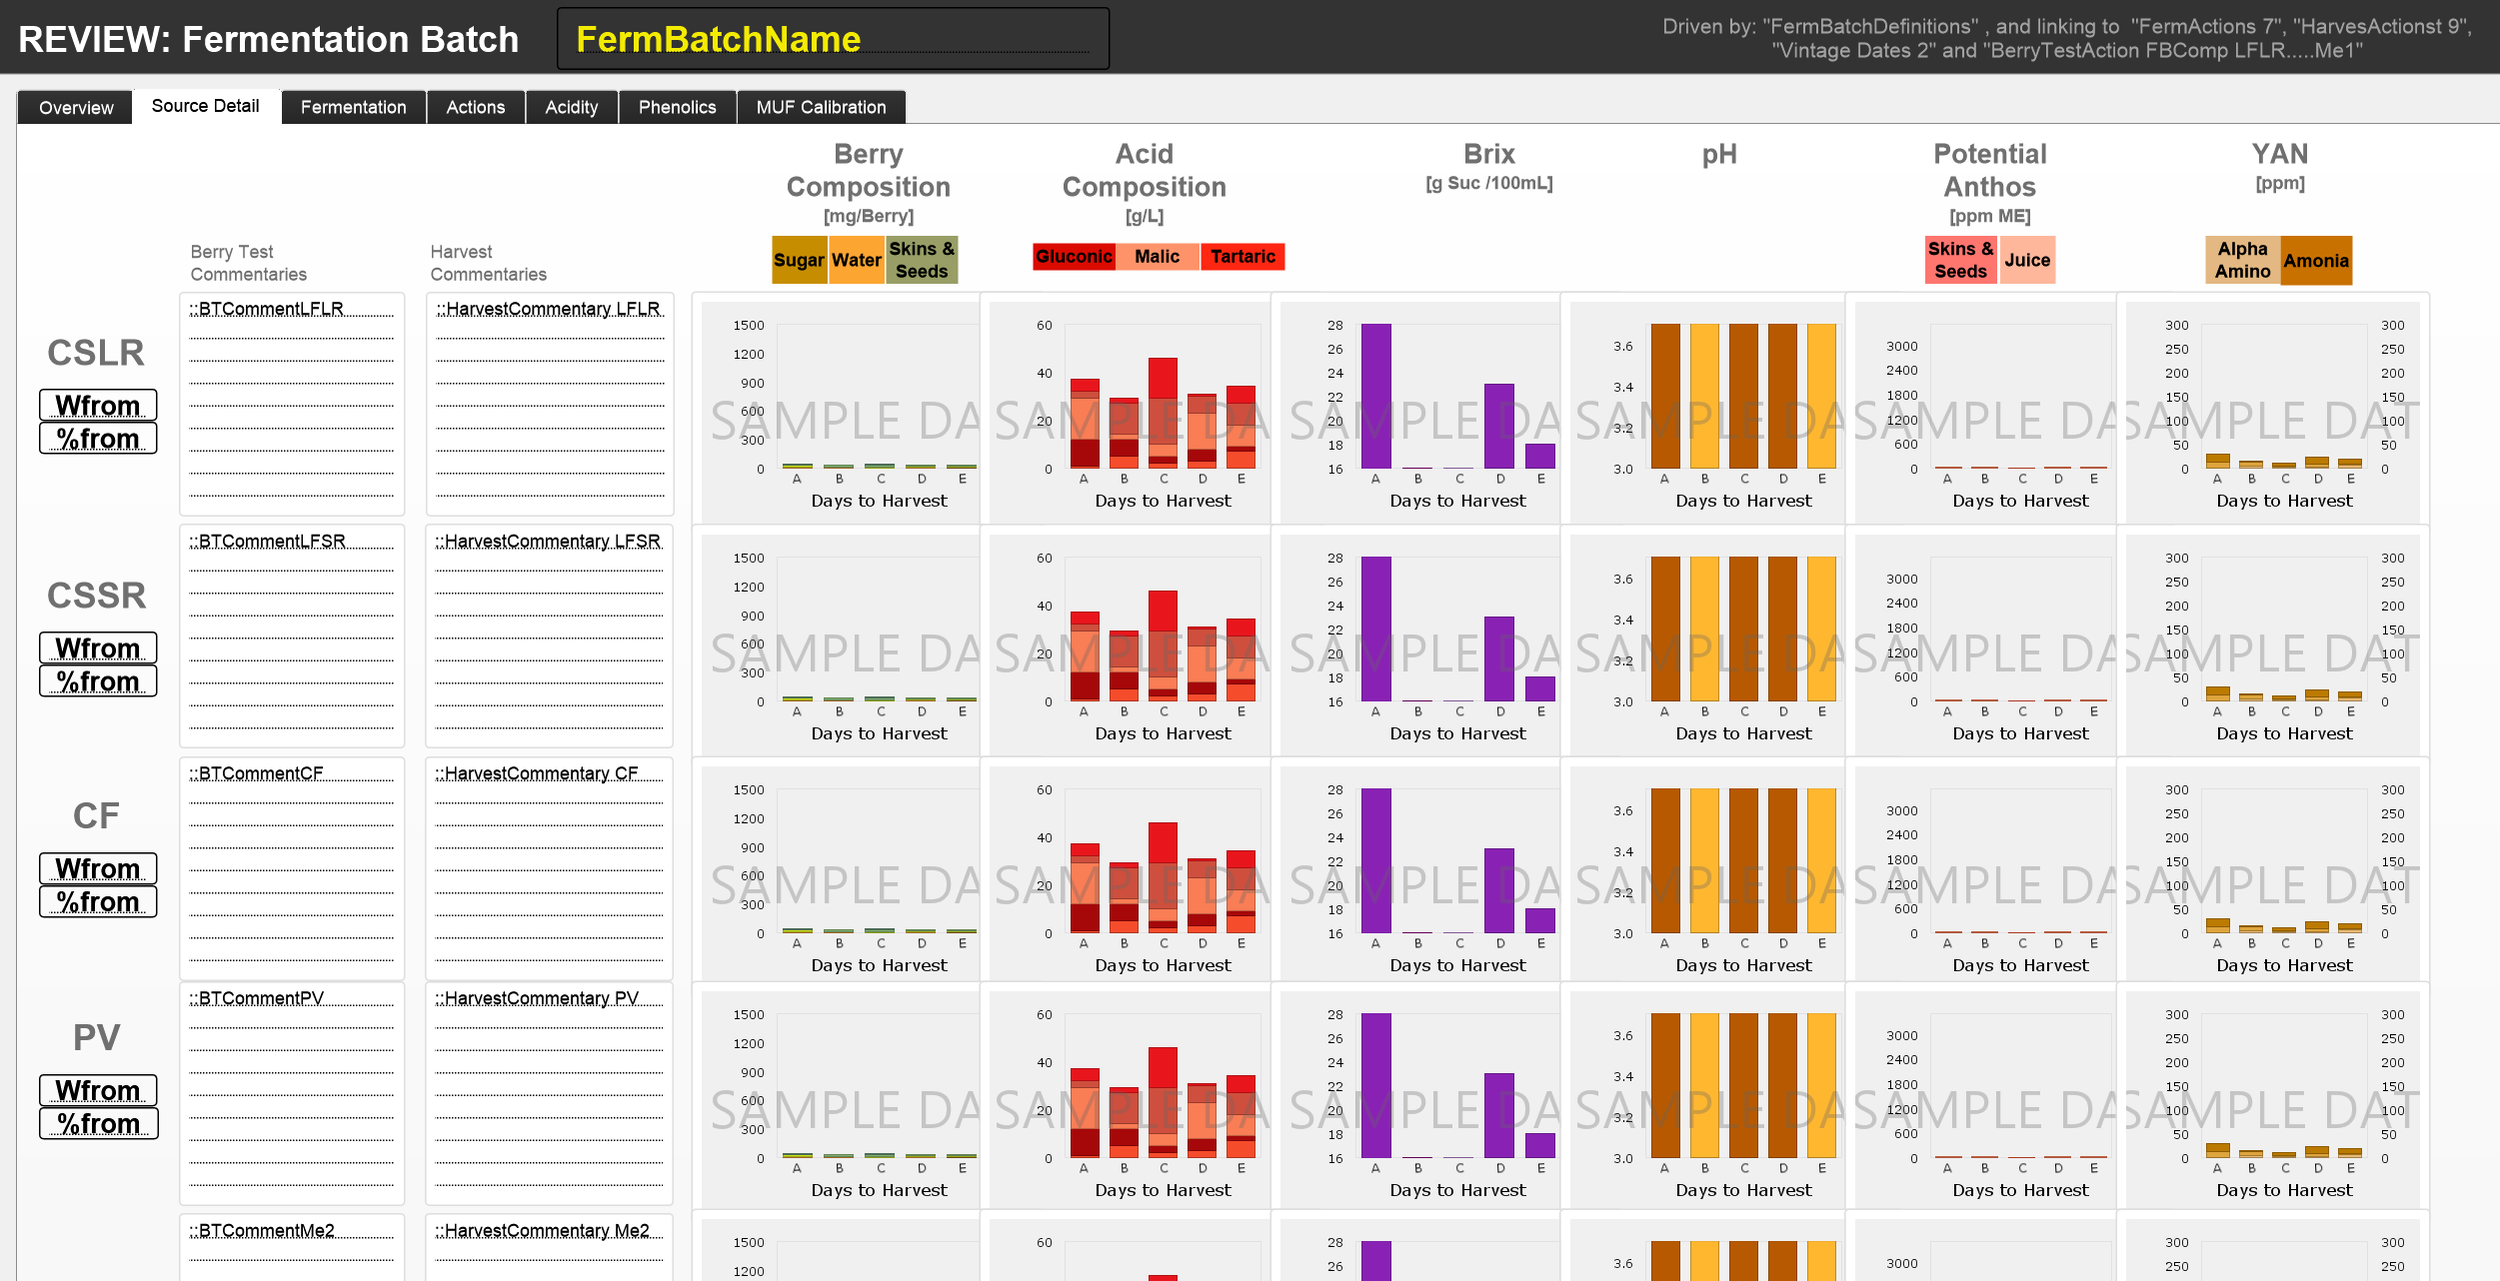
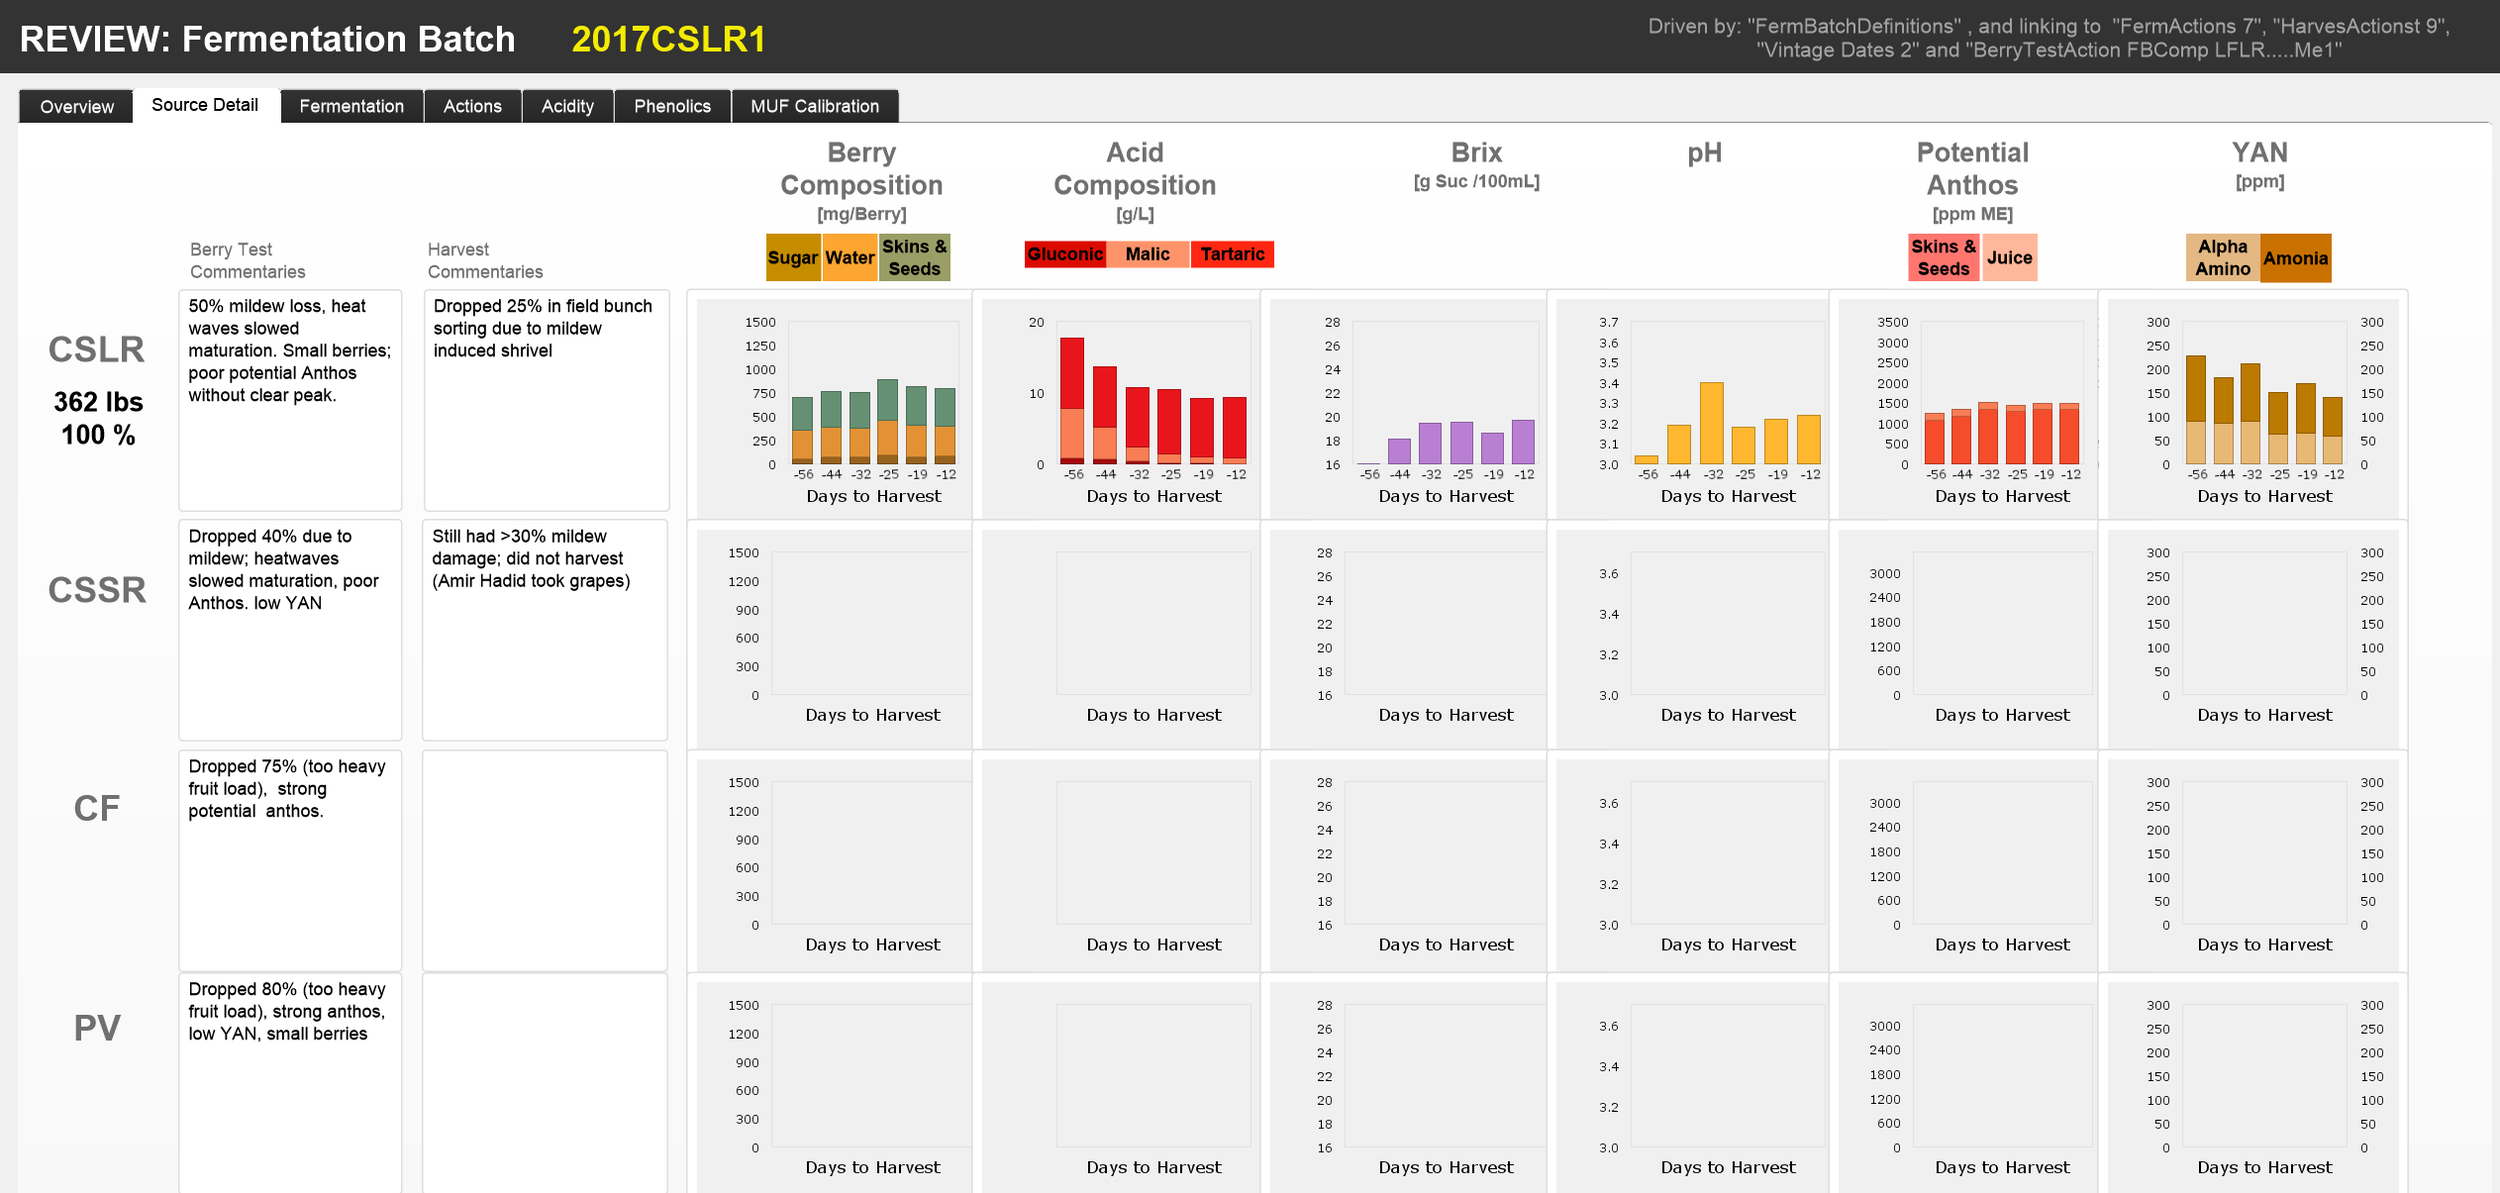
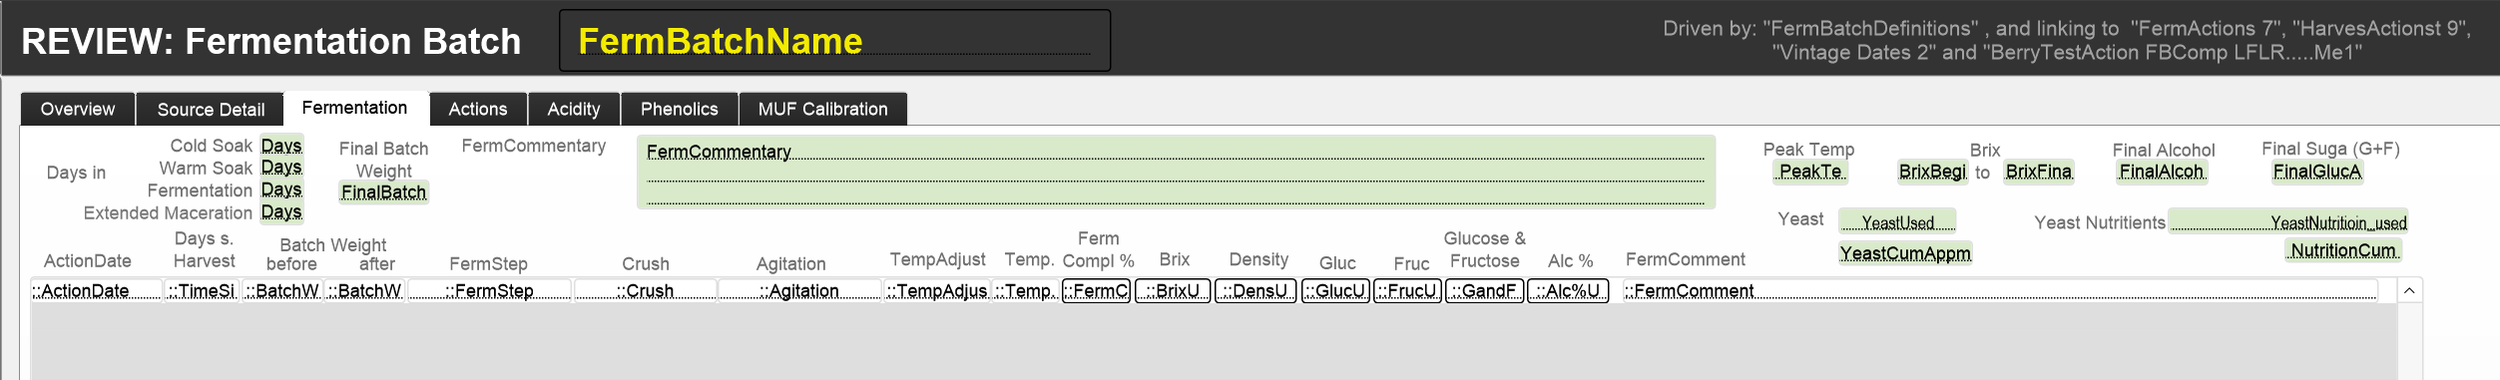
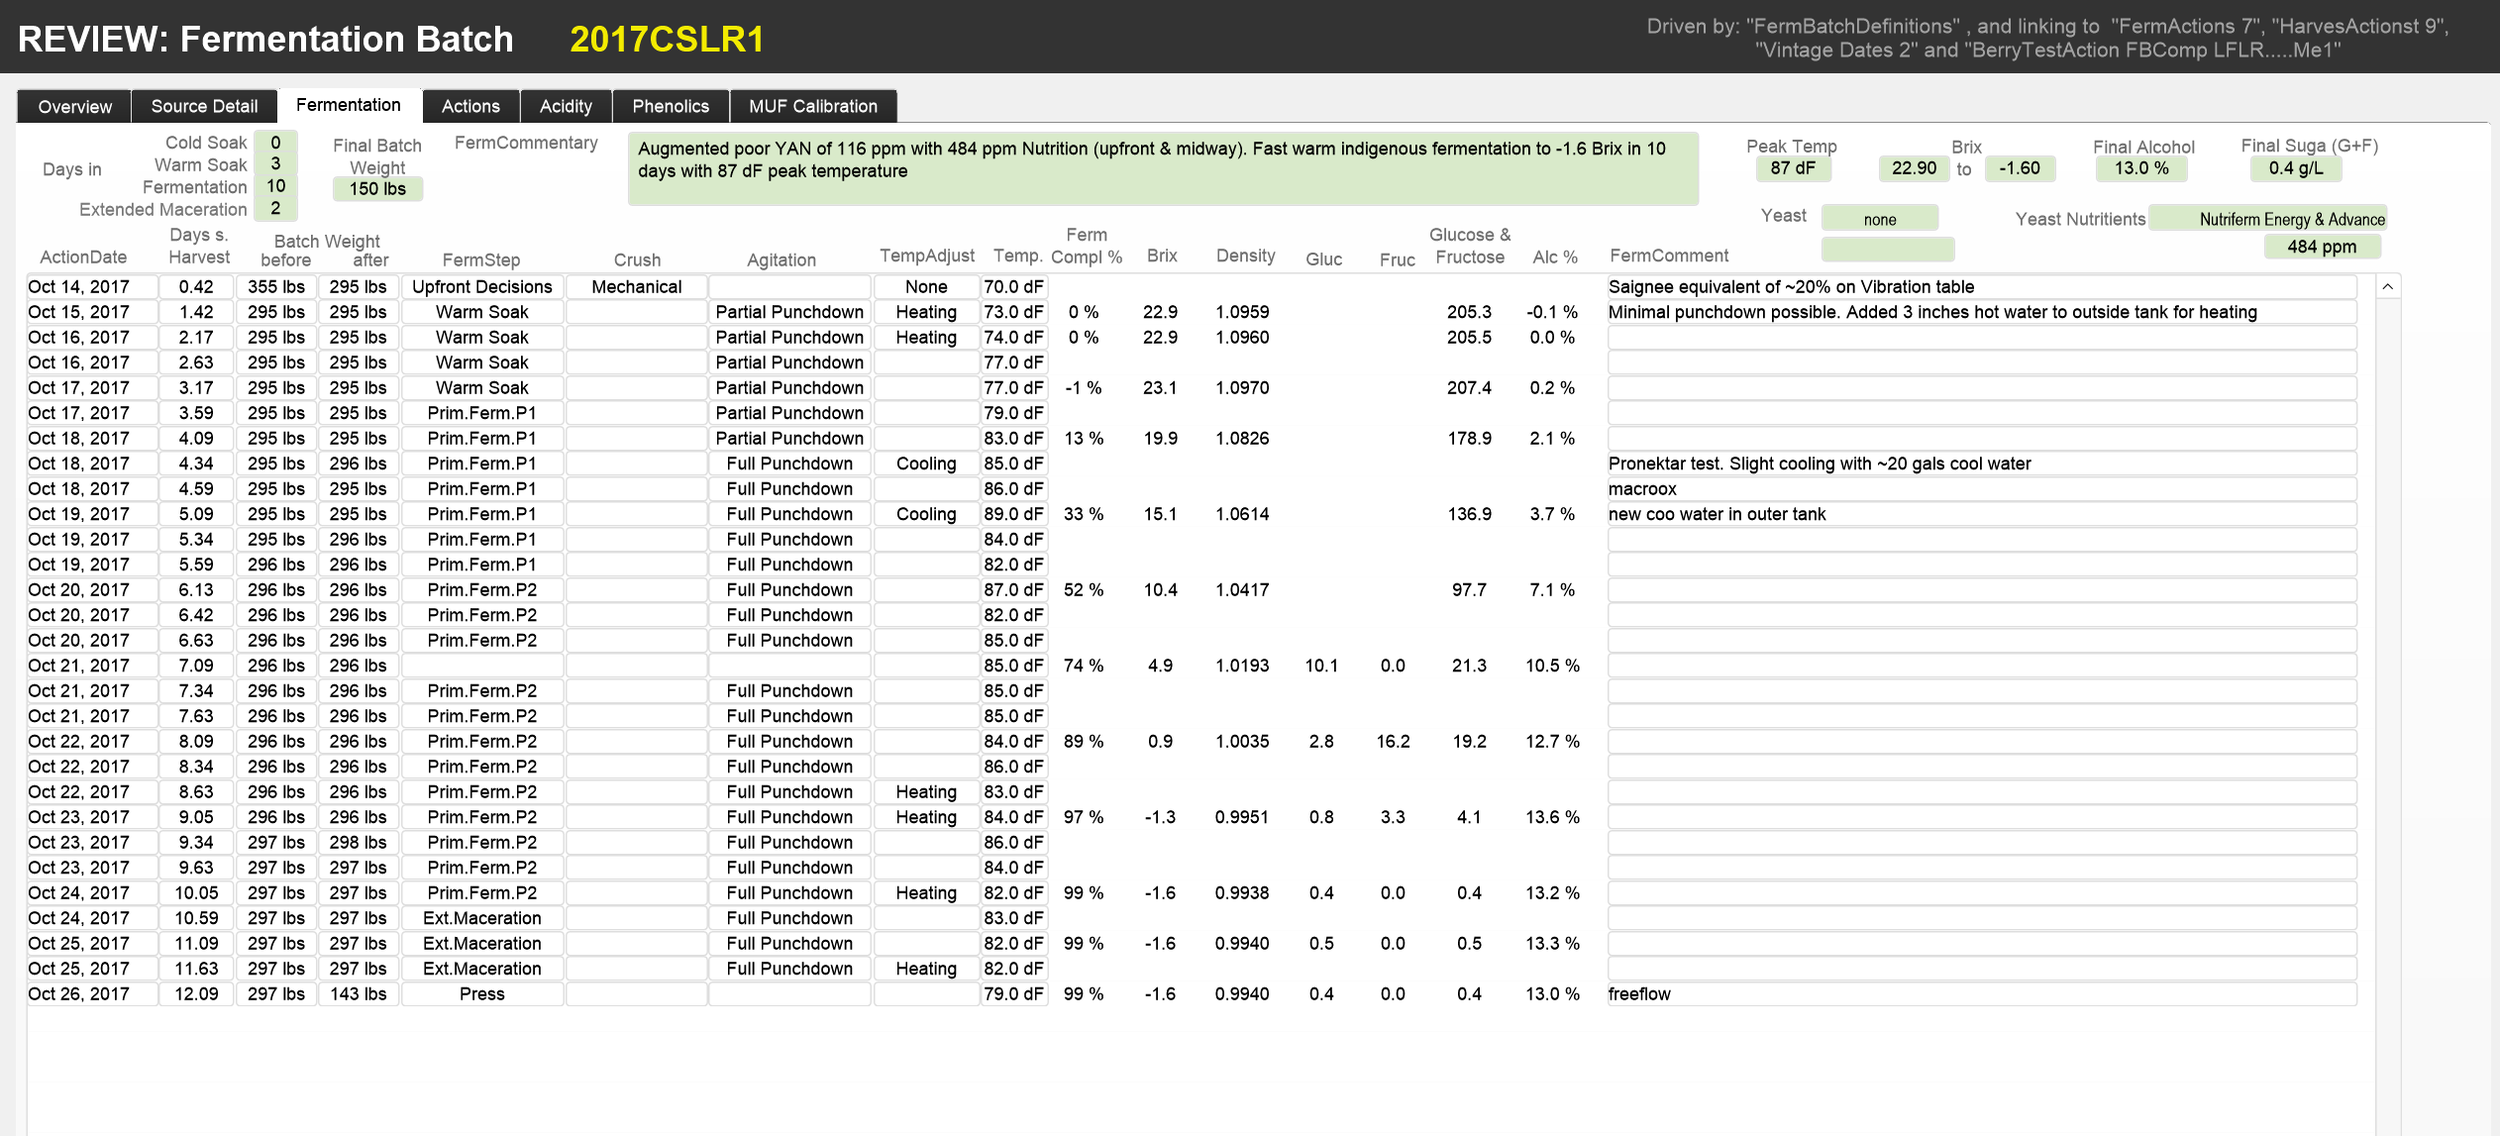
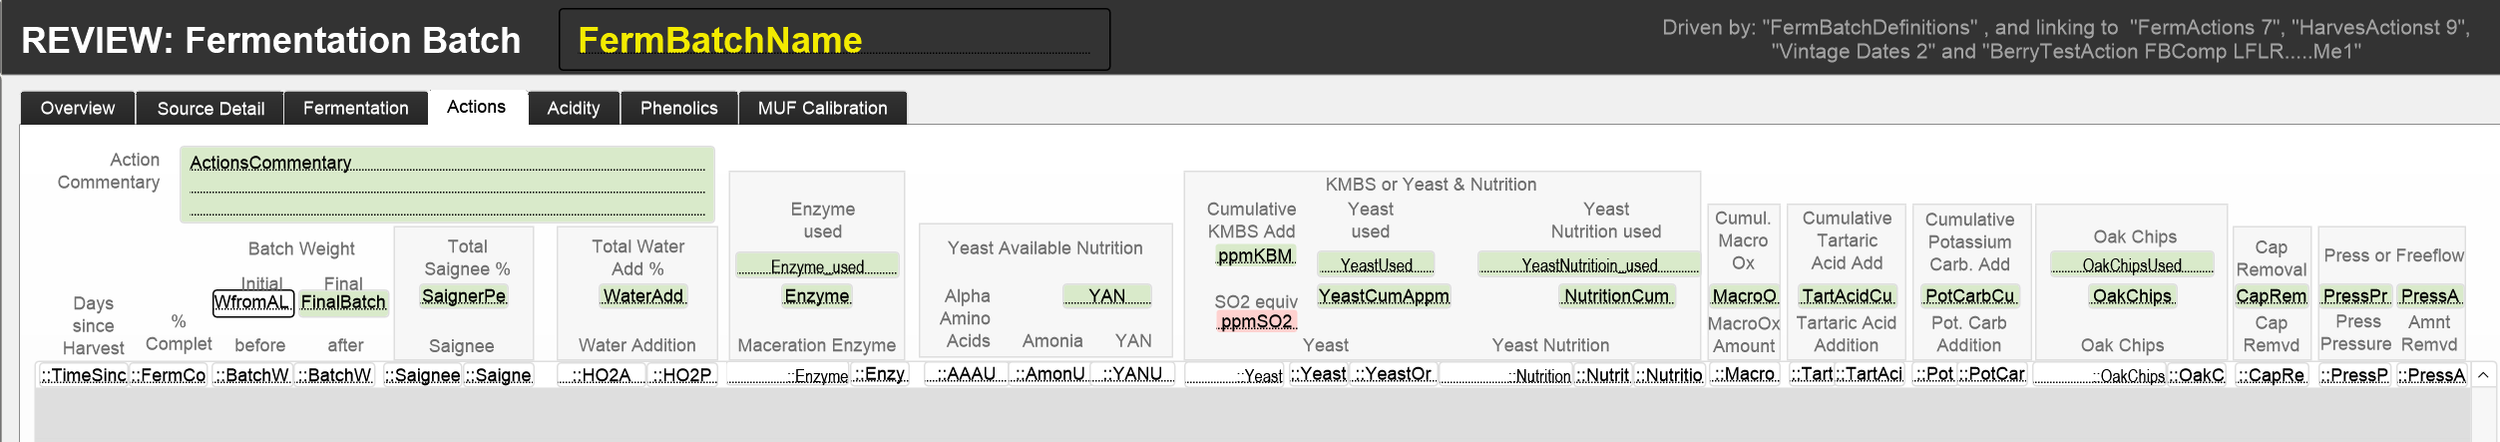
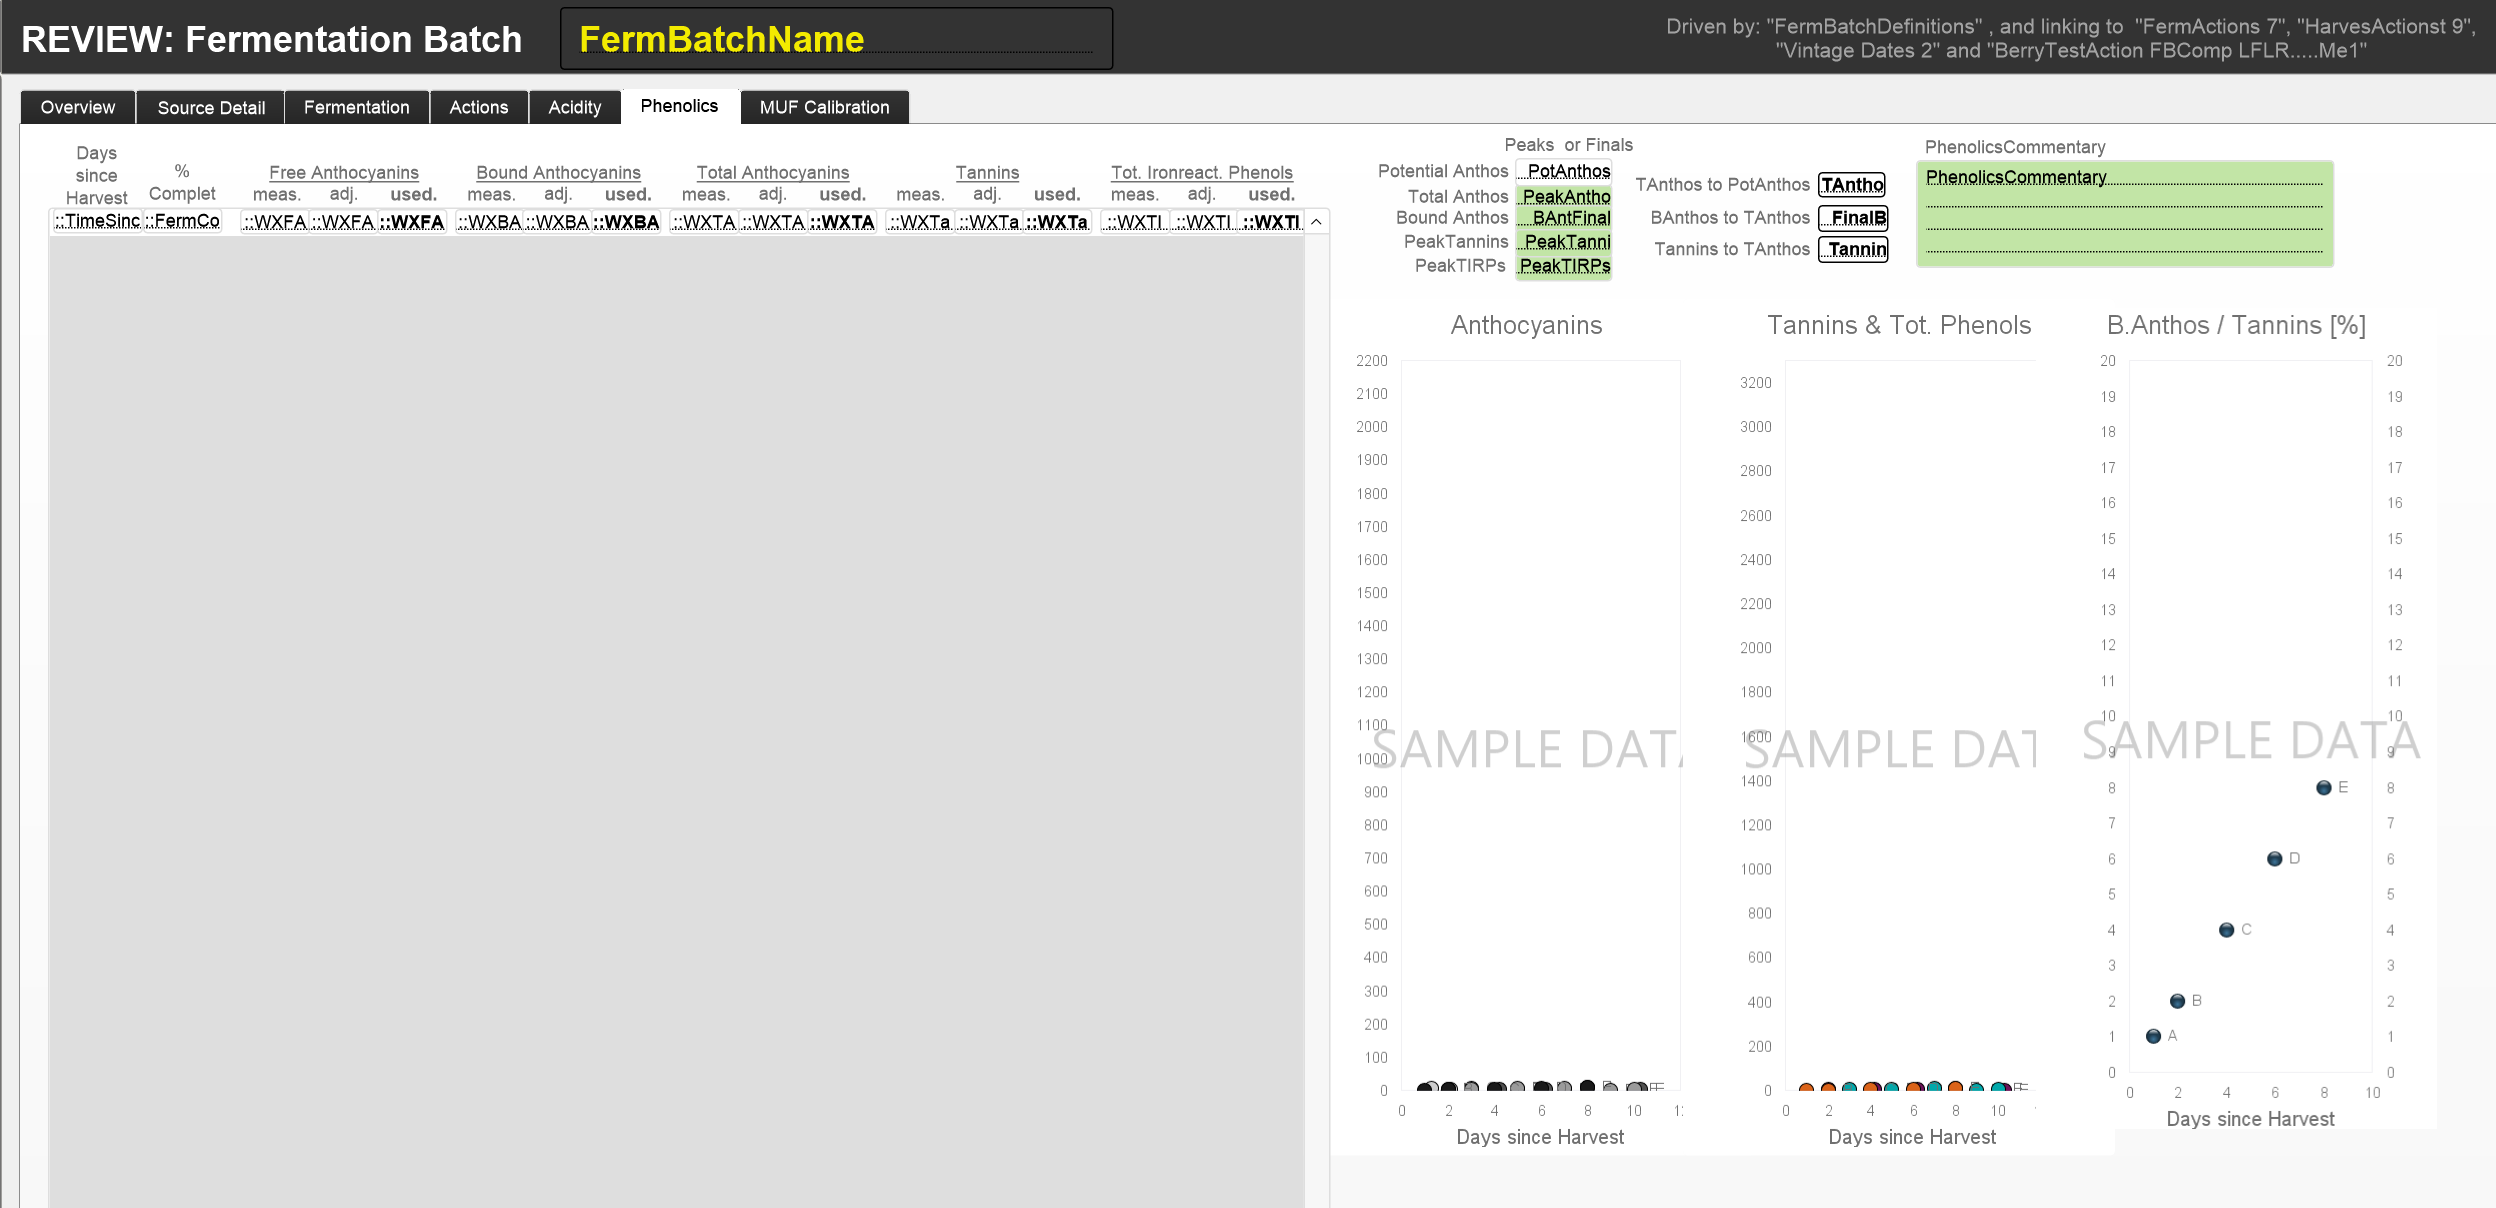
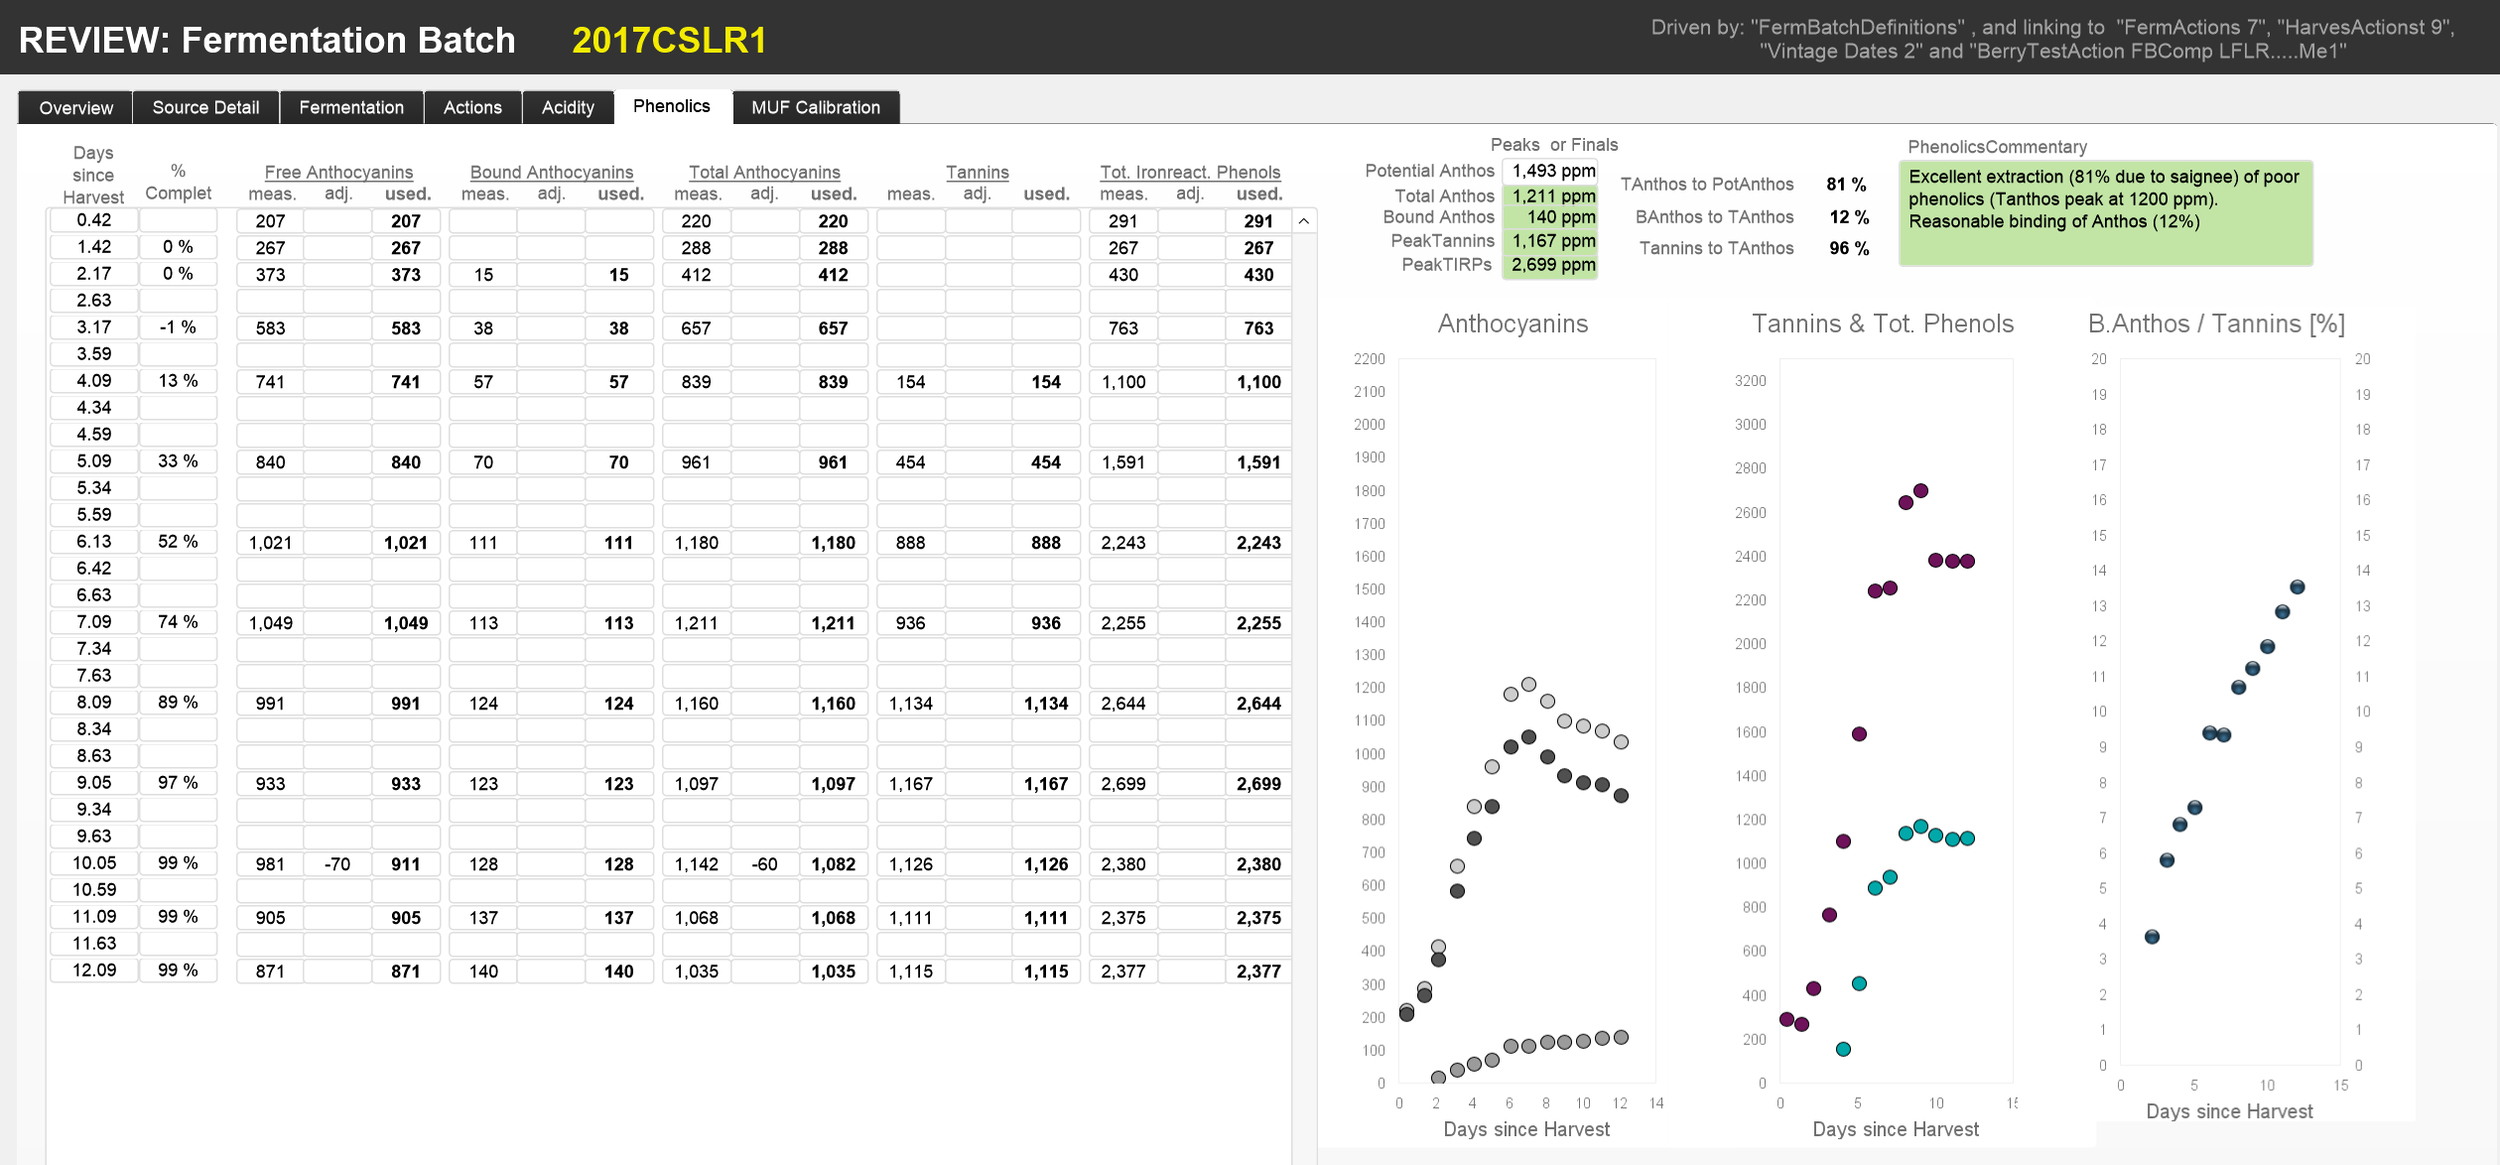
REVIEW: Fermentation Batch
The “REVIEW: Fermentation Batch” layout pulls together all the data collected during the fermentation of a particular fermentation batch. We use it to review each fermentation batch and add summary comments. It has 7 tabs:
- The Overview tab summarises how a fermentation progressed and the result; it draws key data and commentaries from the other tabs.
- The Source Detail tab recaps the characteristics of the components of the fermentation batch.
- The Fermentation tab provides the details on how the fermentation progressed.
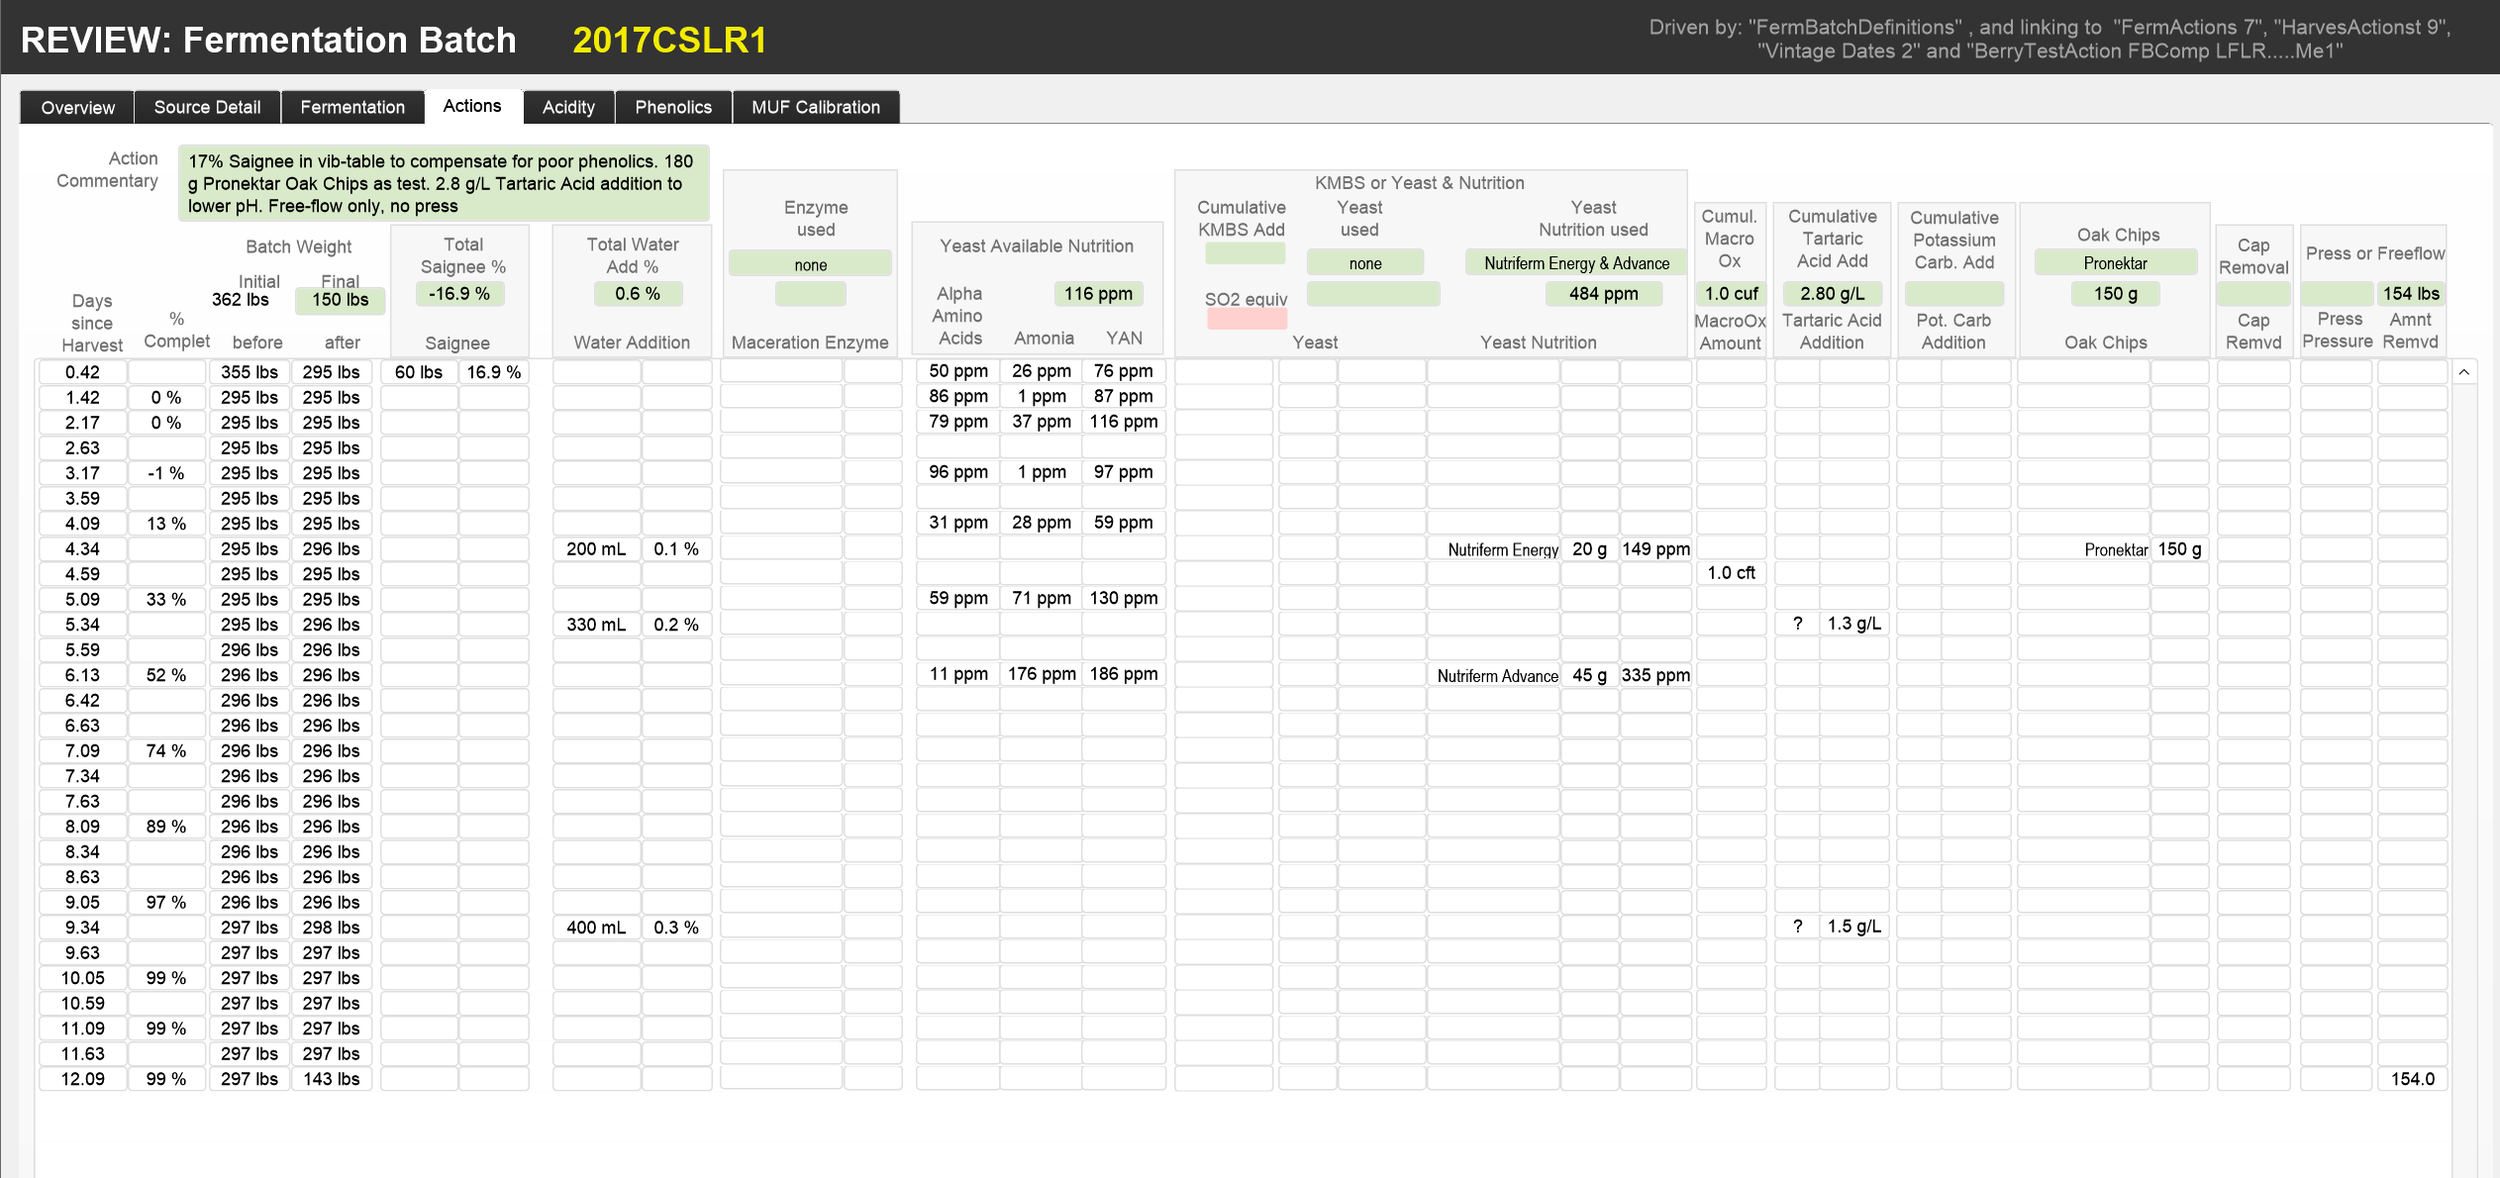
- The Action tab shows the actions taken during the fermentation.
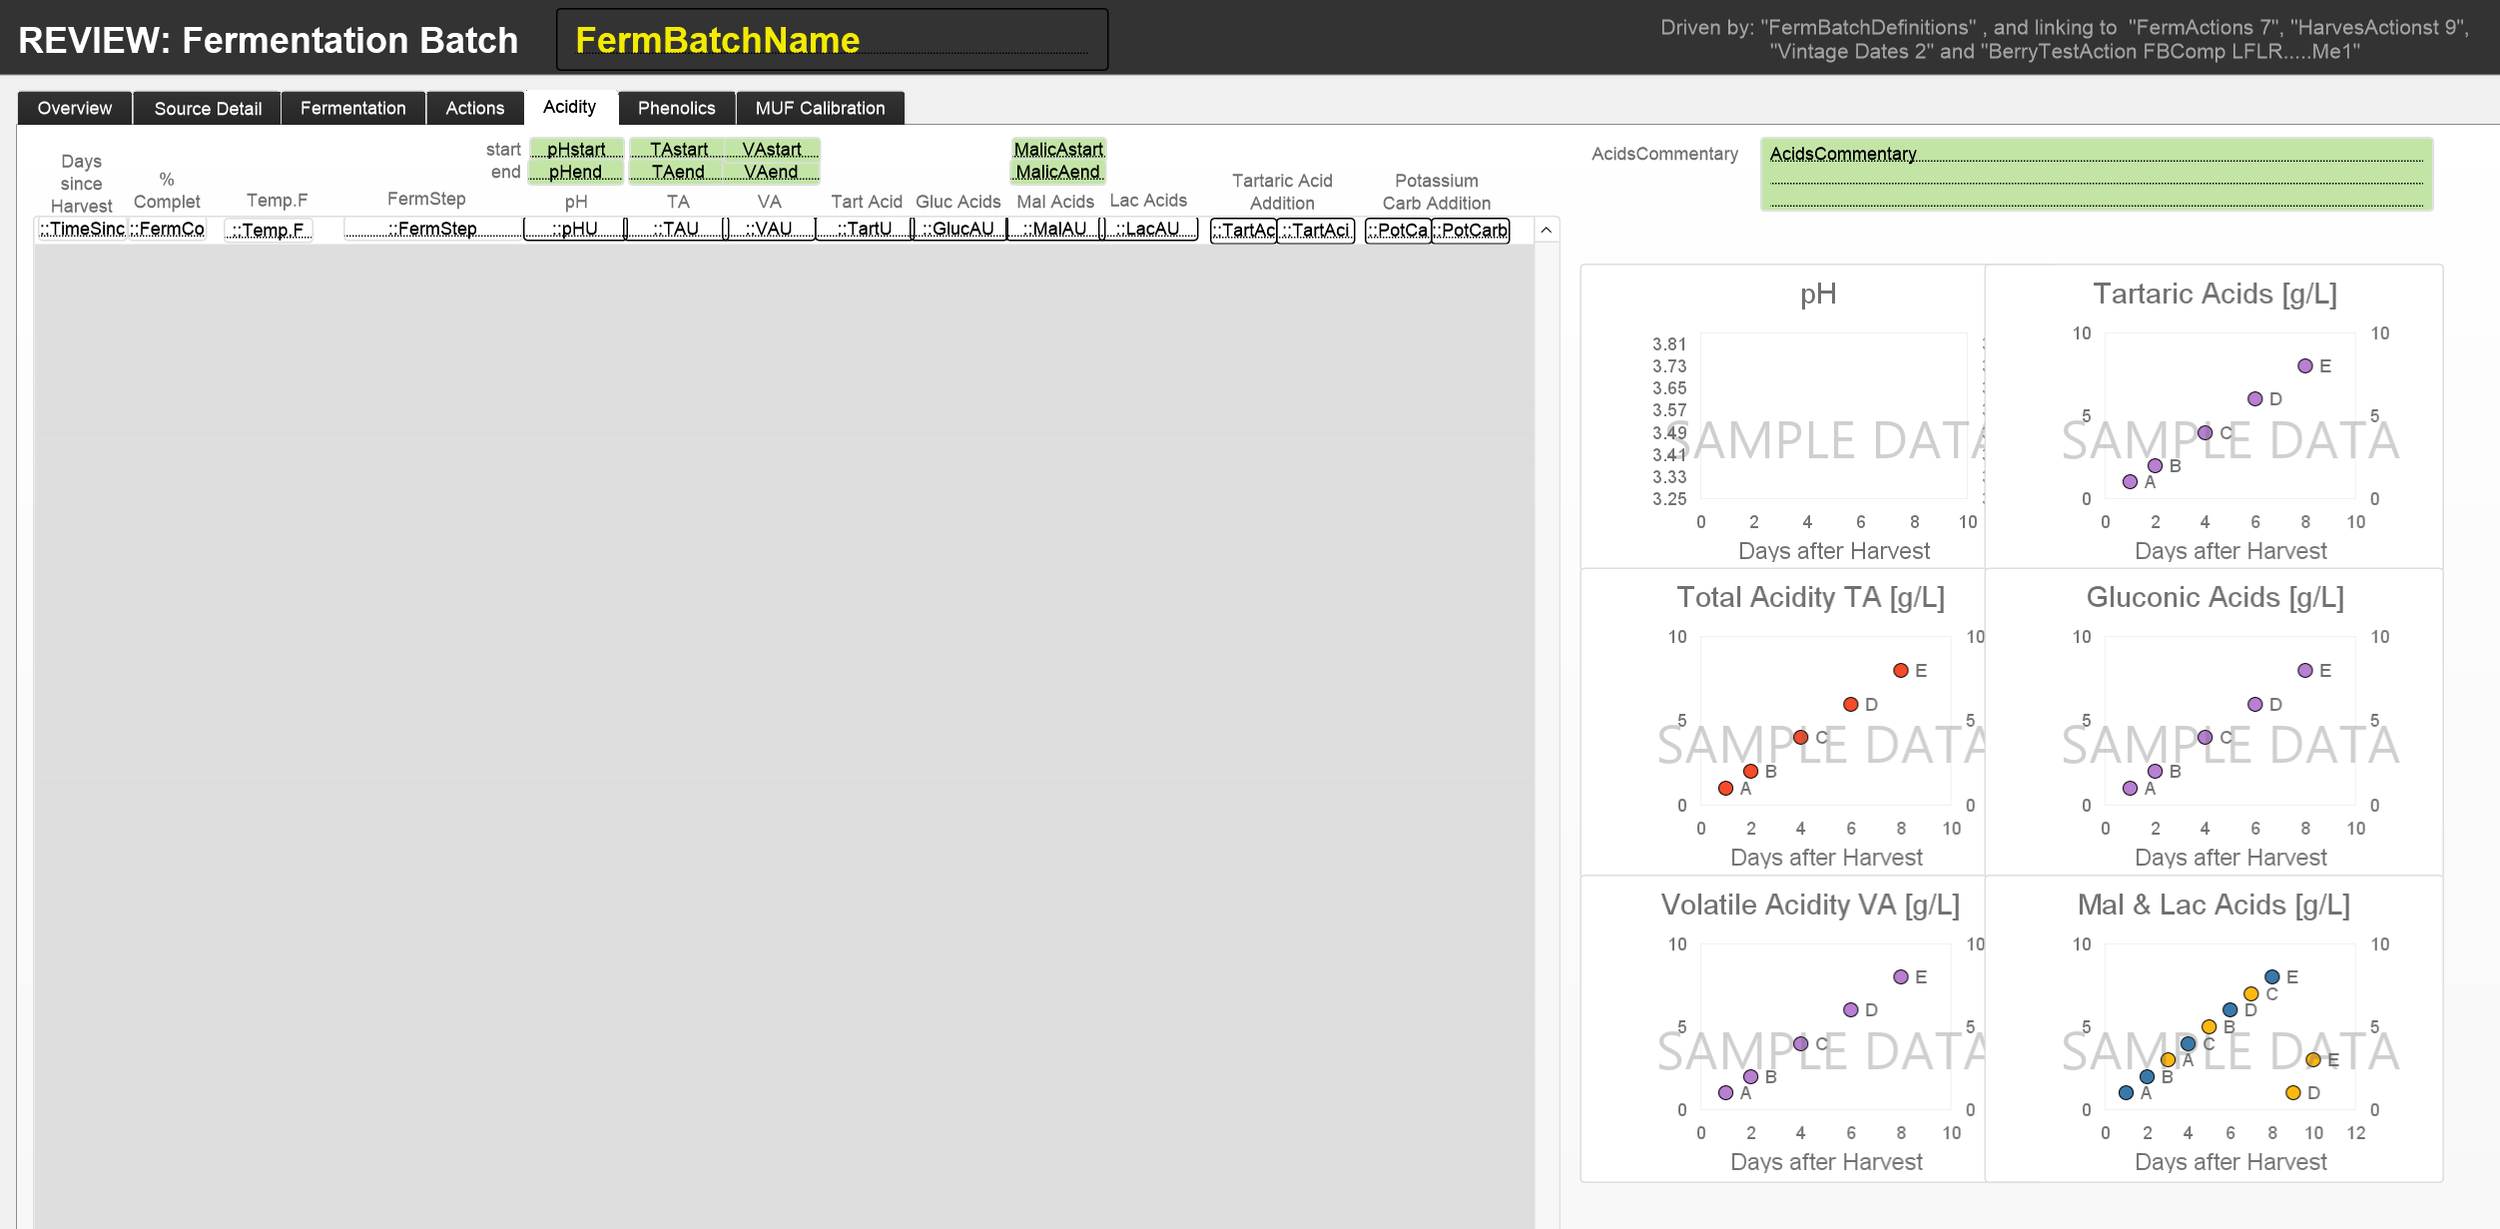
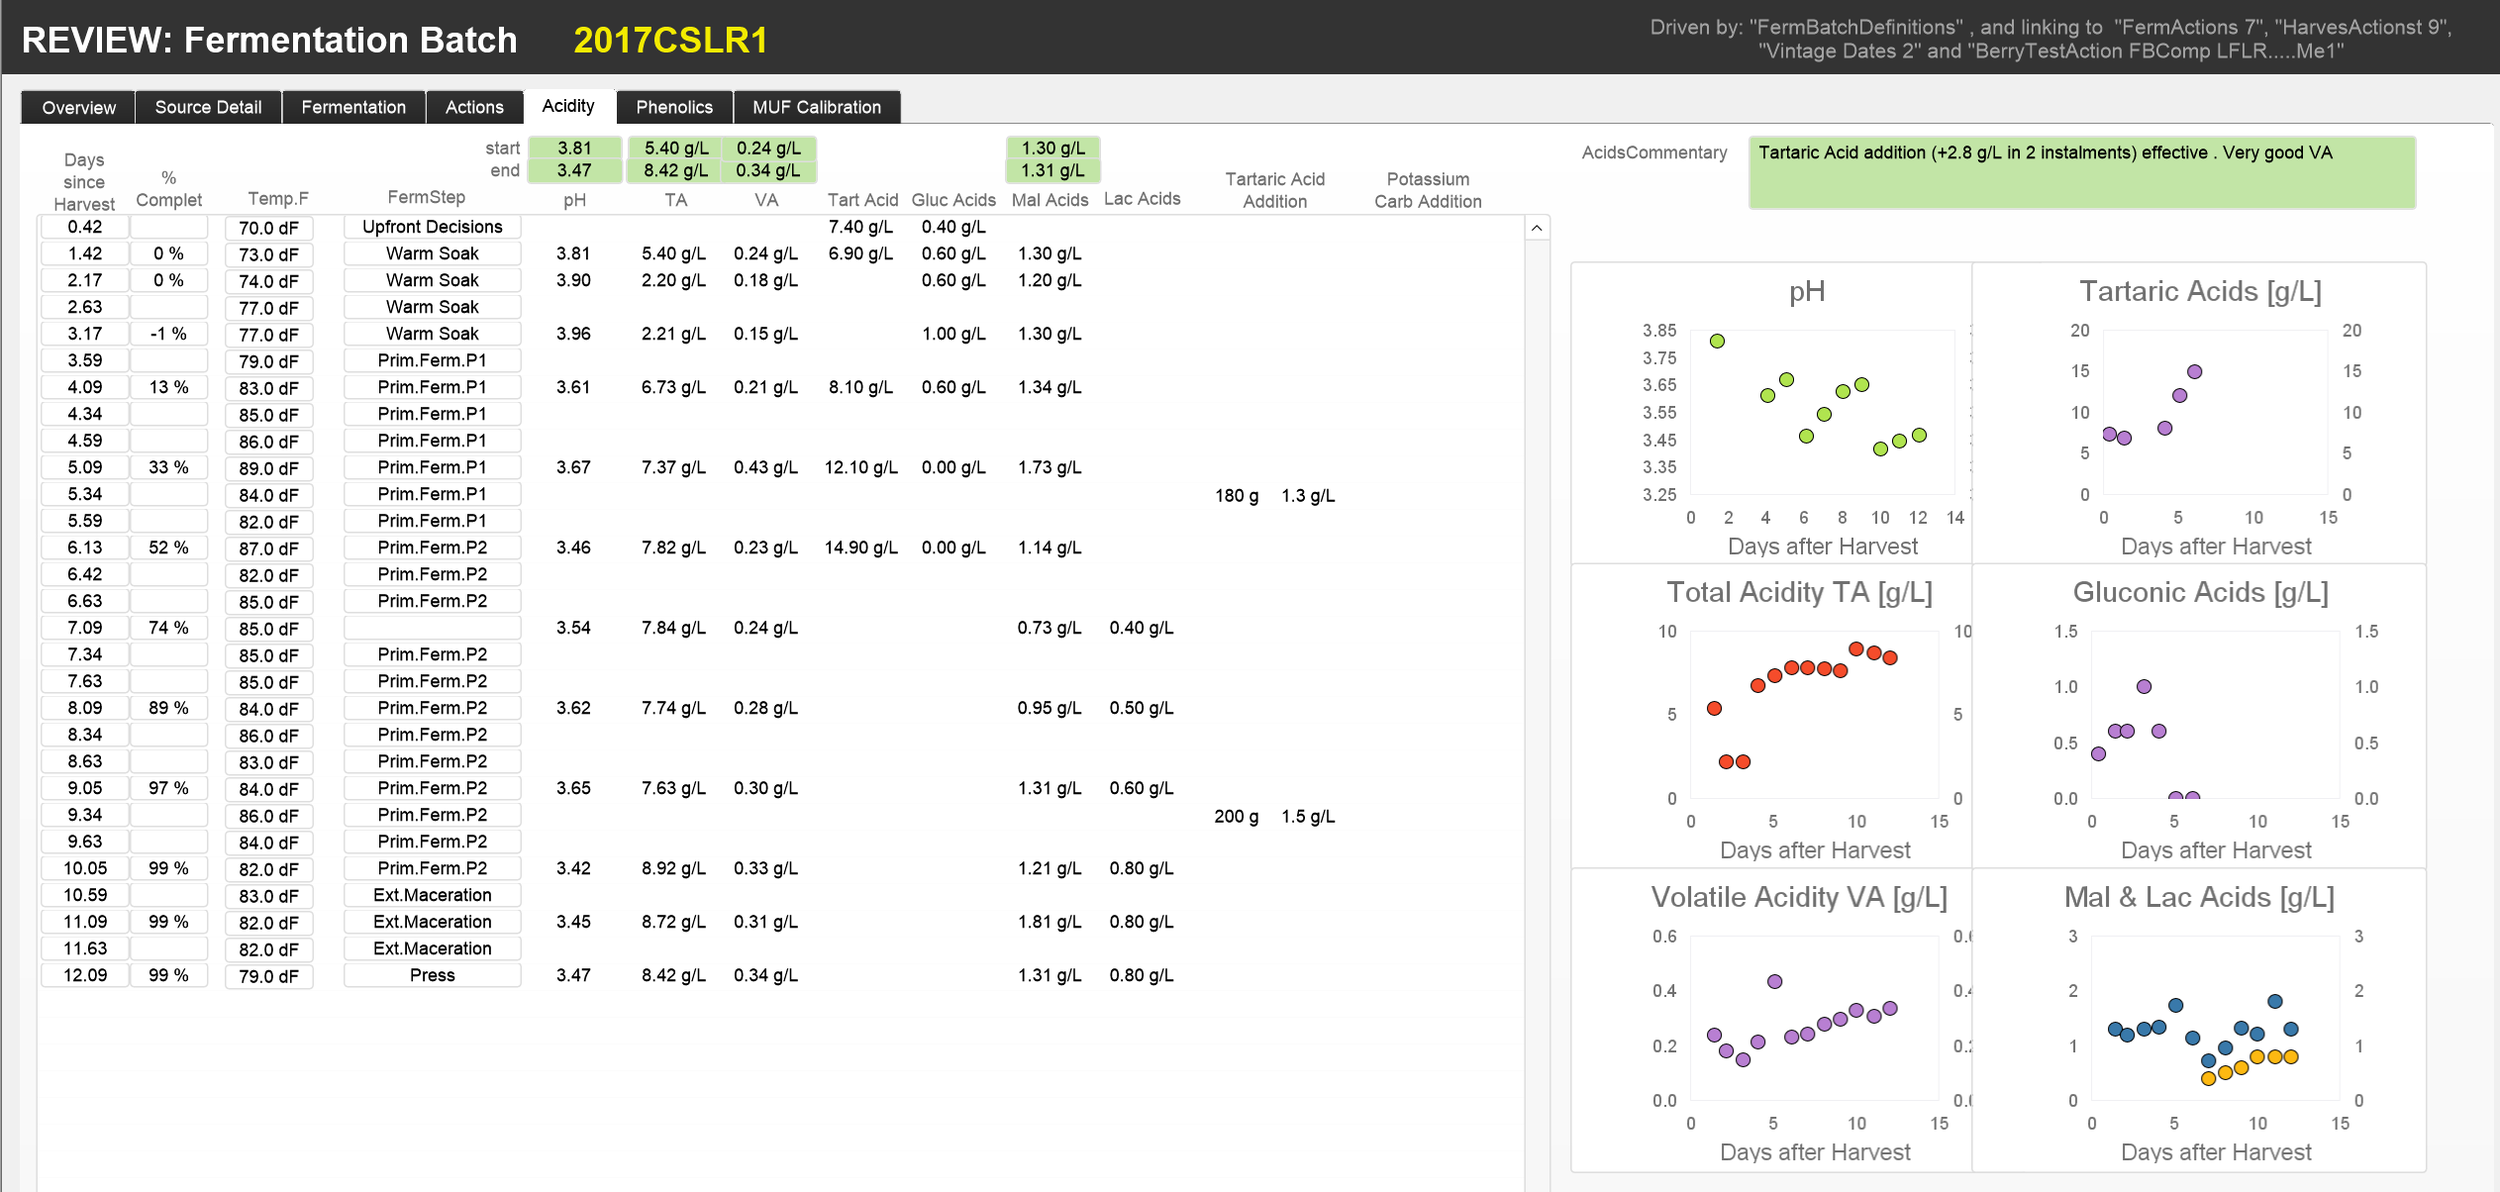
- The Acidity and the Phenolics tabs show how the acids and the phenolics evolved during fermentation.
- The MUF calibration tab shows how the Must-Under-Fermentation measurements with OenoFoss were calibrated.
This graphic shows the relationships defined for reviewing fermentation actions. At the centre is the FermBatchDefinitions table which links to various instances of the FermActions table, the BerryTestActions table, the HarvestActions table etc.

The following screenshots show the 7 tabs for the fermentation batch review in sequence; first the layout with field names, then, as an example the data for the 2017_CFPV_Batch. Note, all the green coloured fields are entered during the review (starting with the tabs in reverse order).
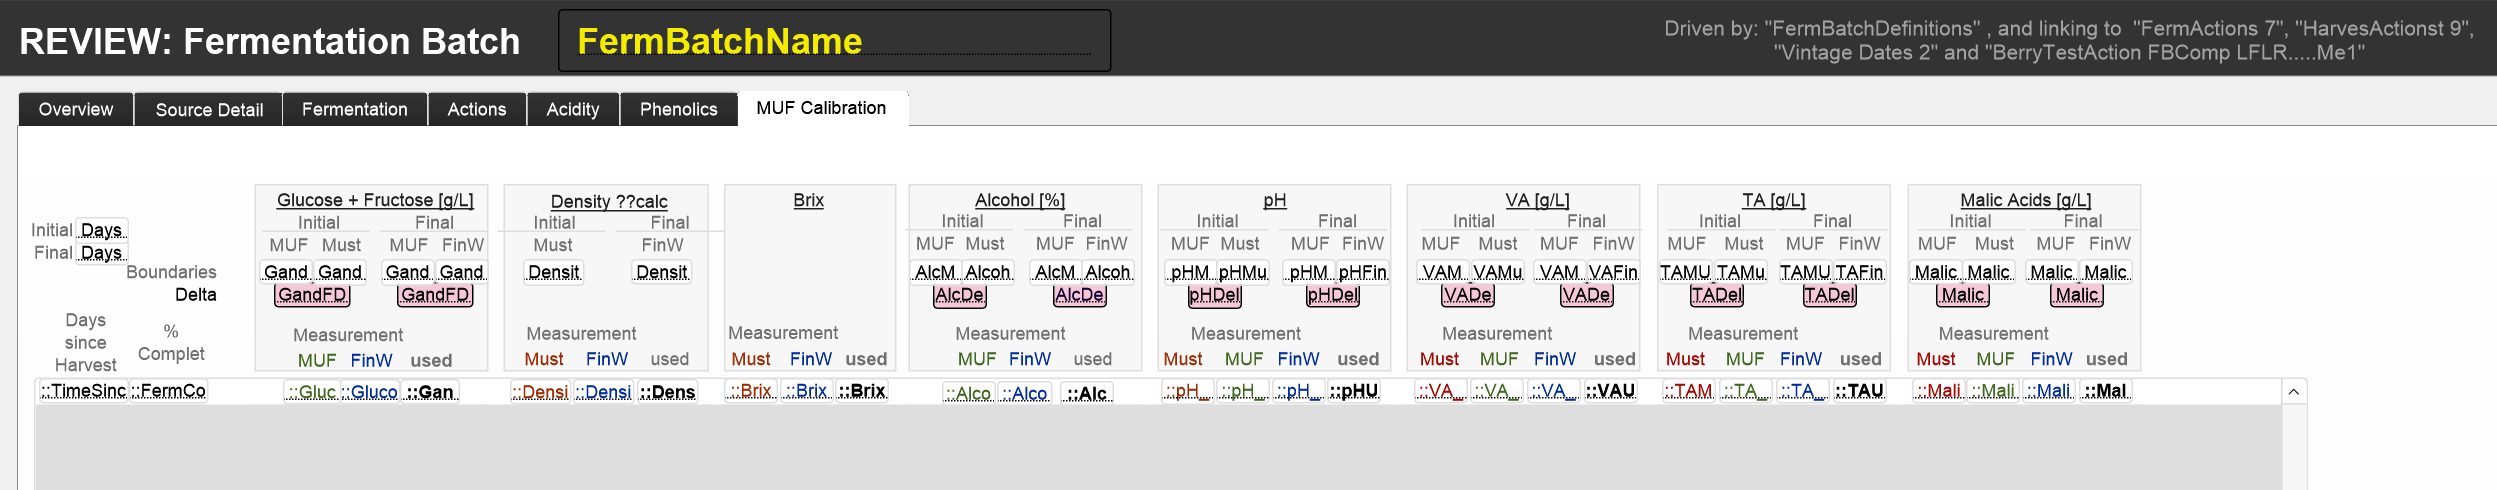
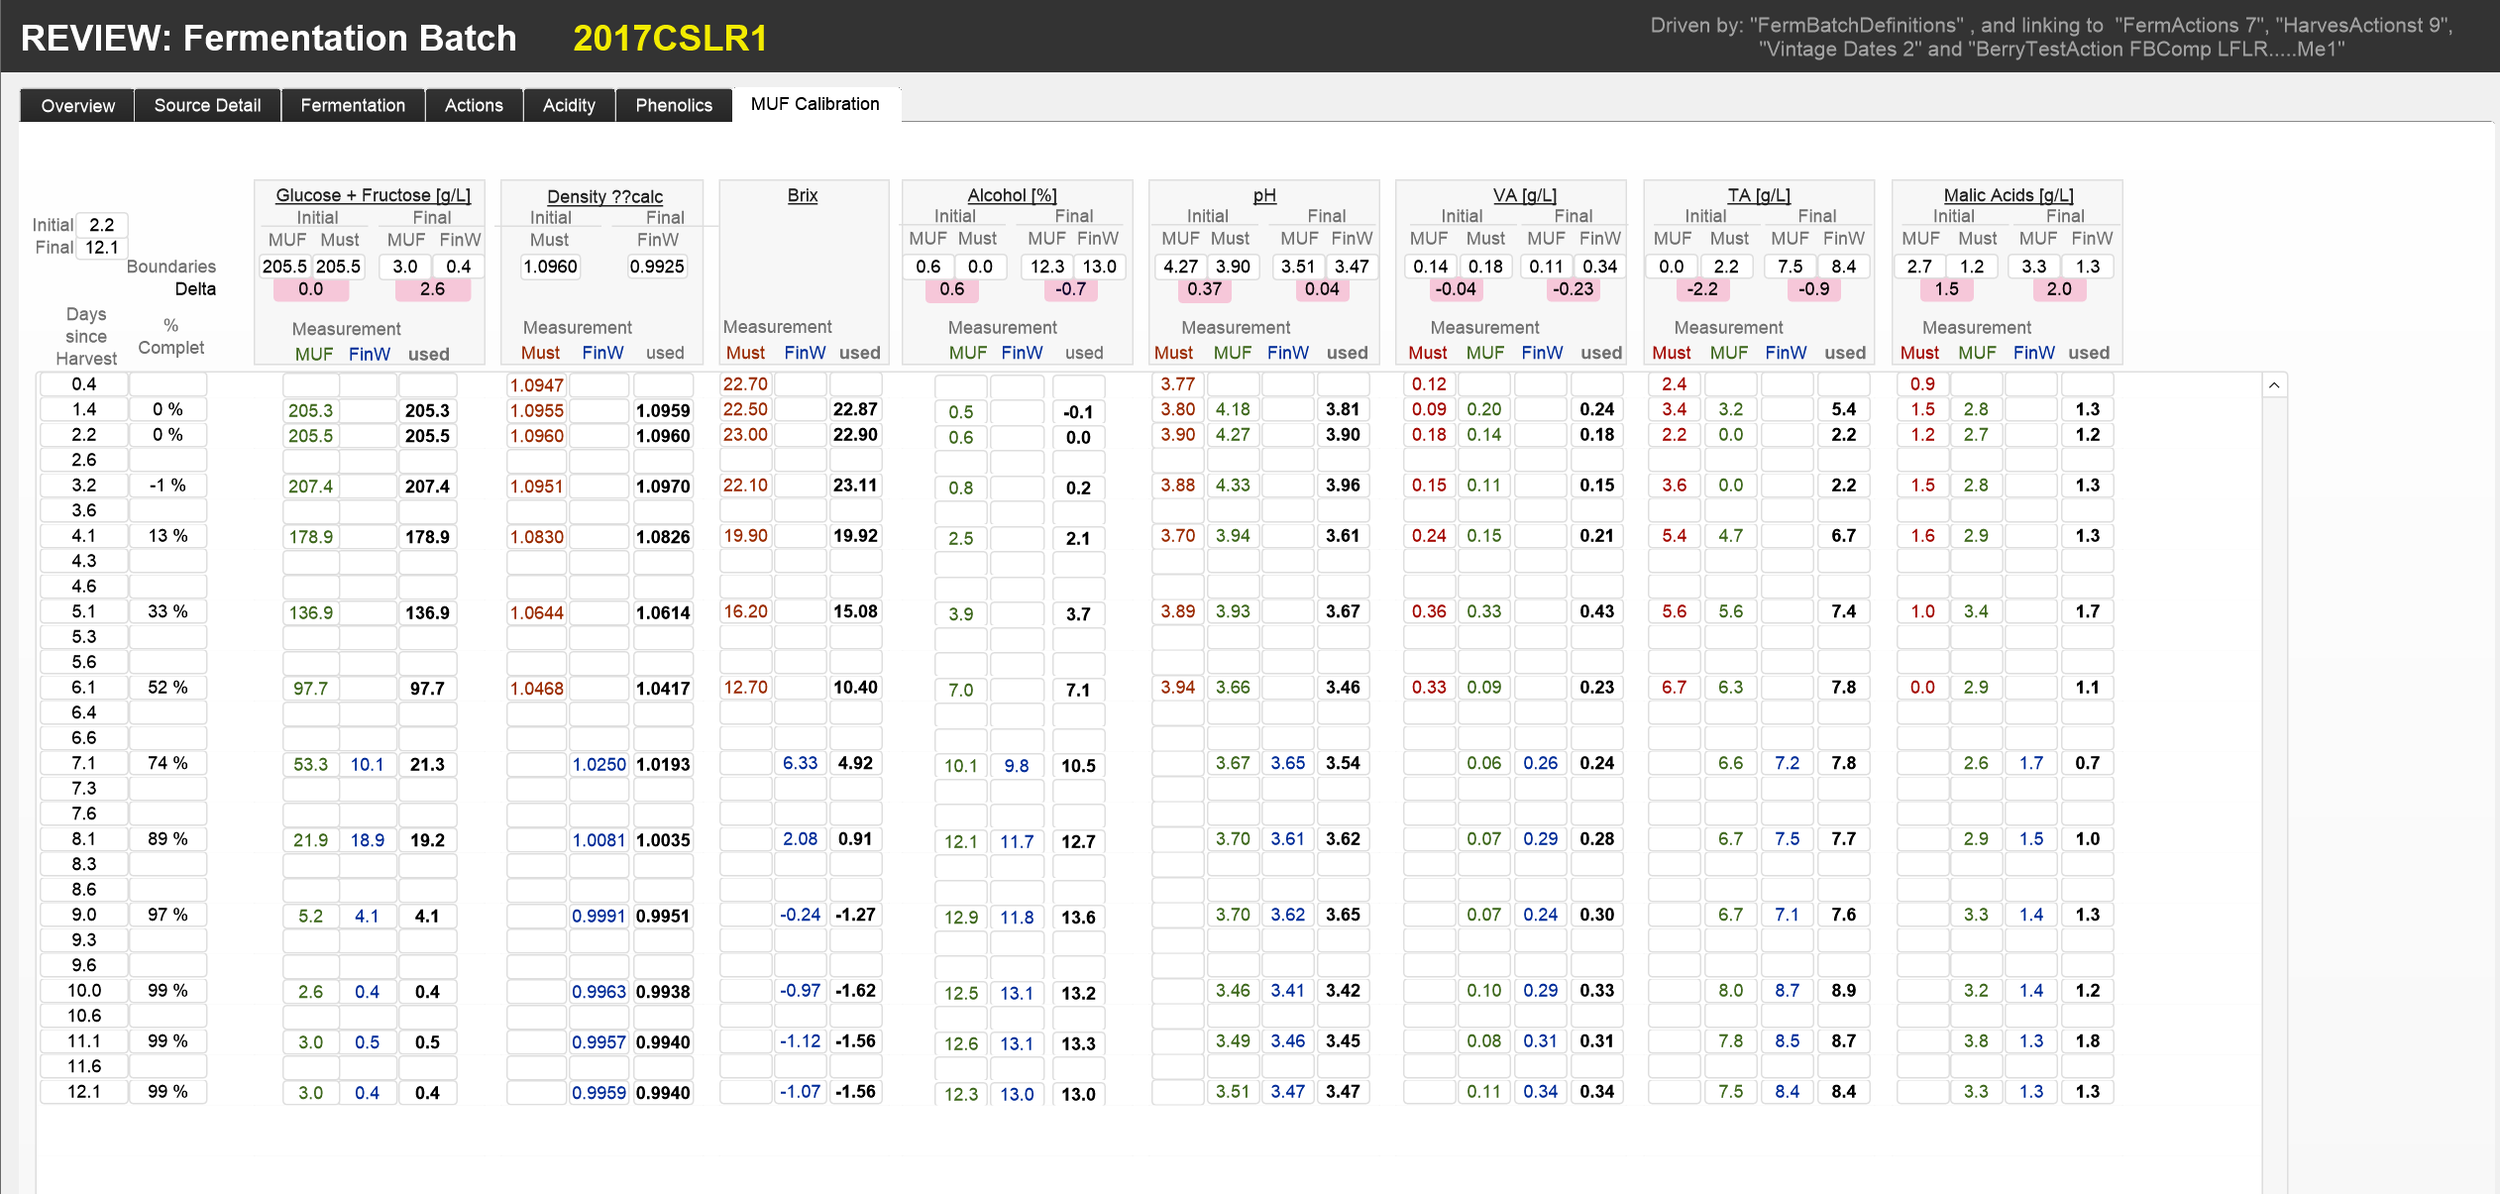
REVIEW: MUF Calibration
The REVIEW: MUF Calibration layout is used to check the calibration of the Must-Under-Fermentation measurements with the OenoFoss instrument. Calibrations of the OenoFoss instrument are only feasible for measurement of stable must or stable wine (i.e. before and after fermentation). We calibrate the MUF measurements by linear interpolation of the initial and final delta between the Must and MUF measurements and the MUF and Finished Wine measurements. Note, calibrated MUF measurements are only available once the fermentation is finished.
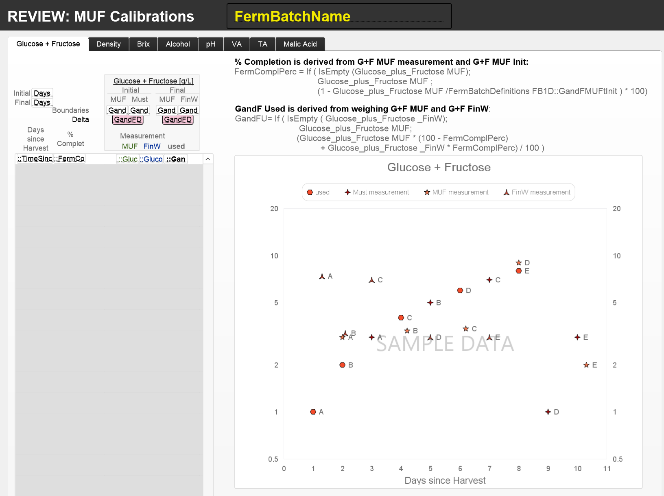
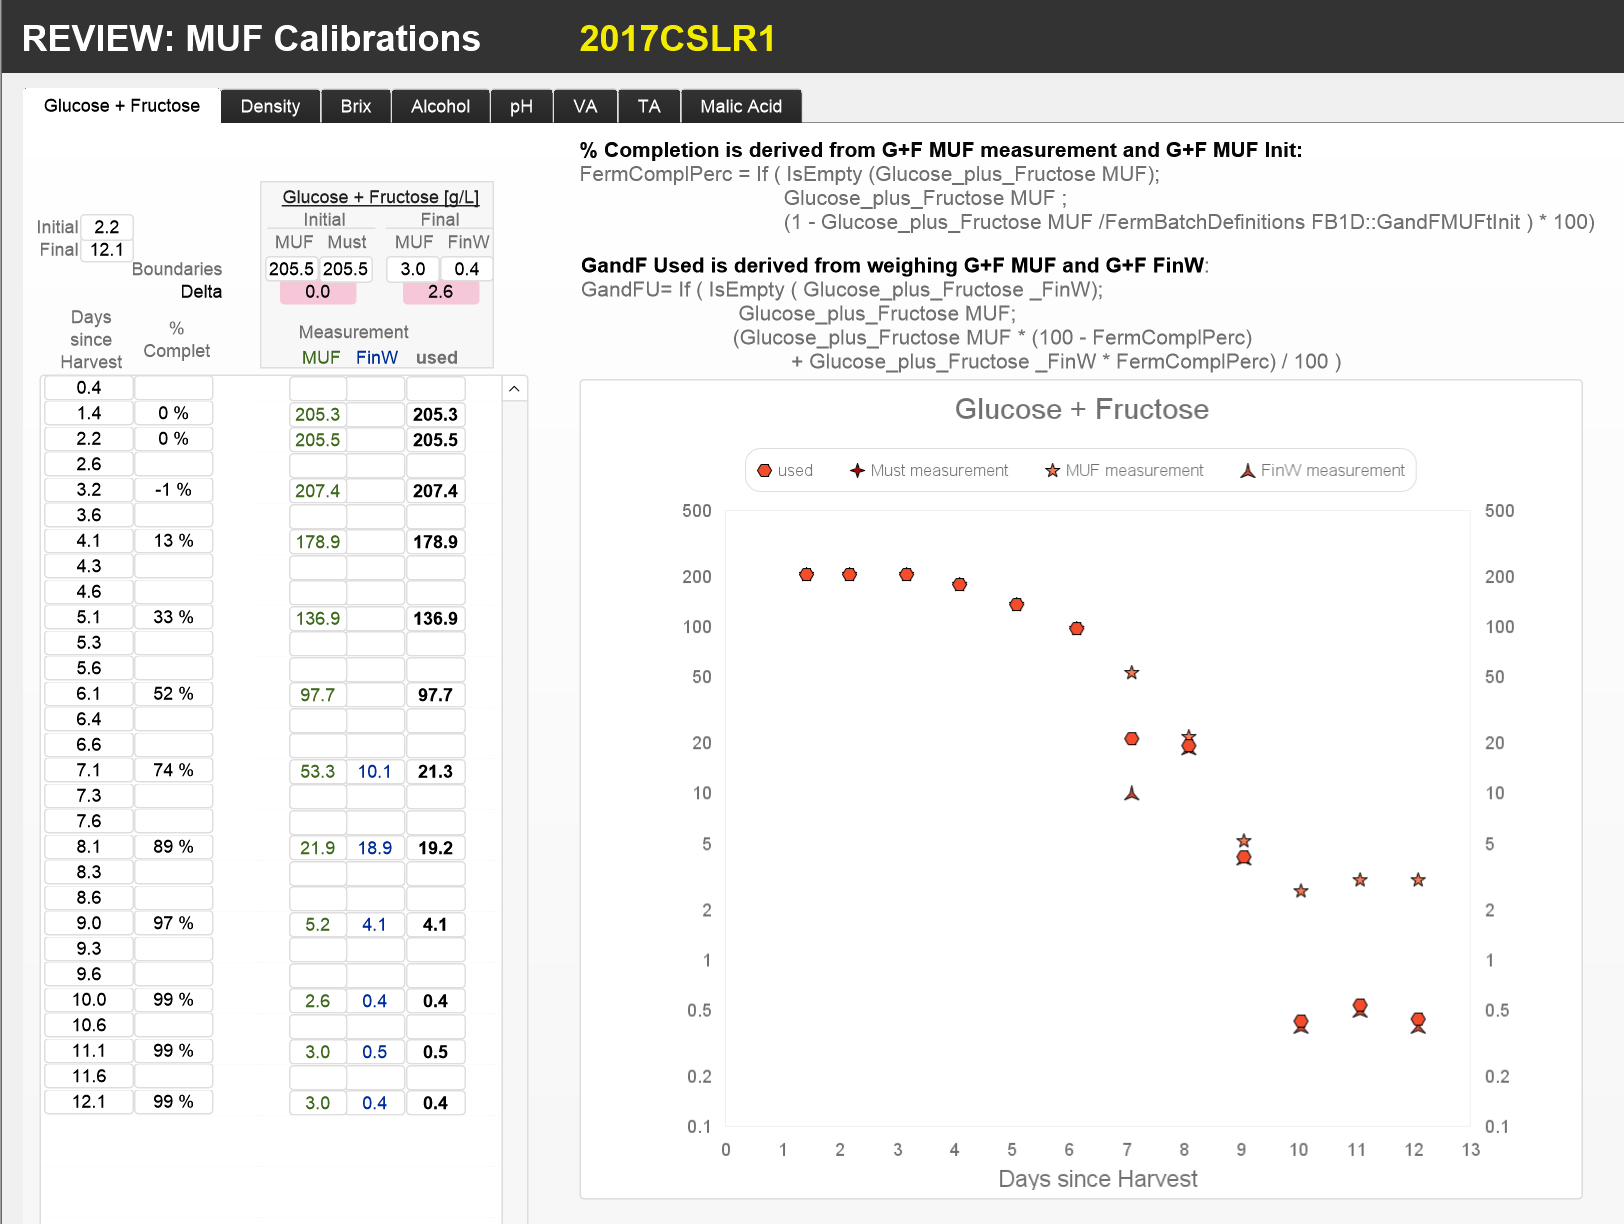
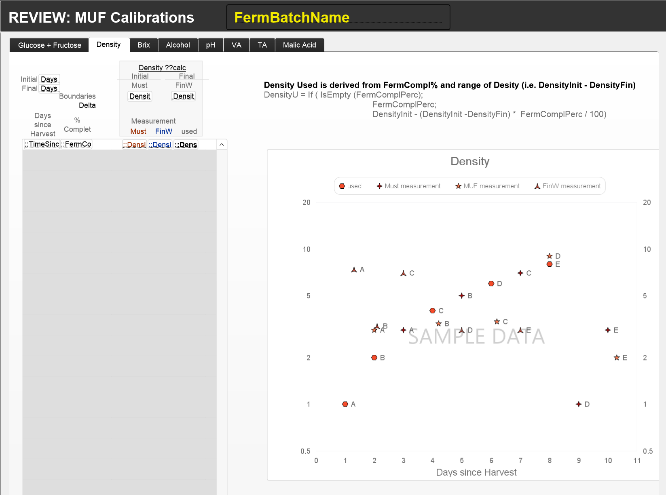
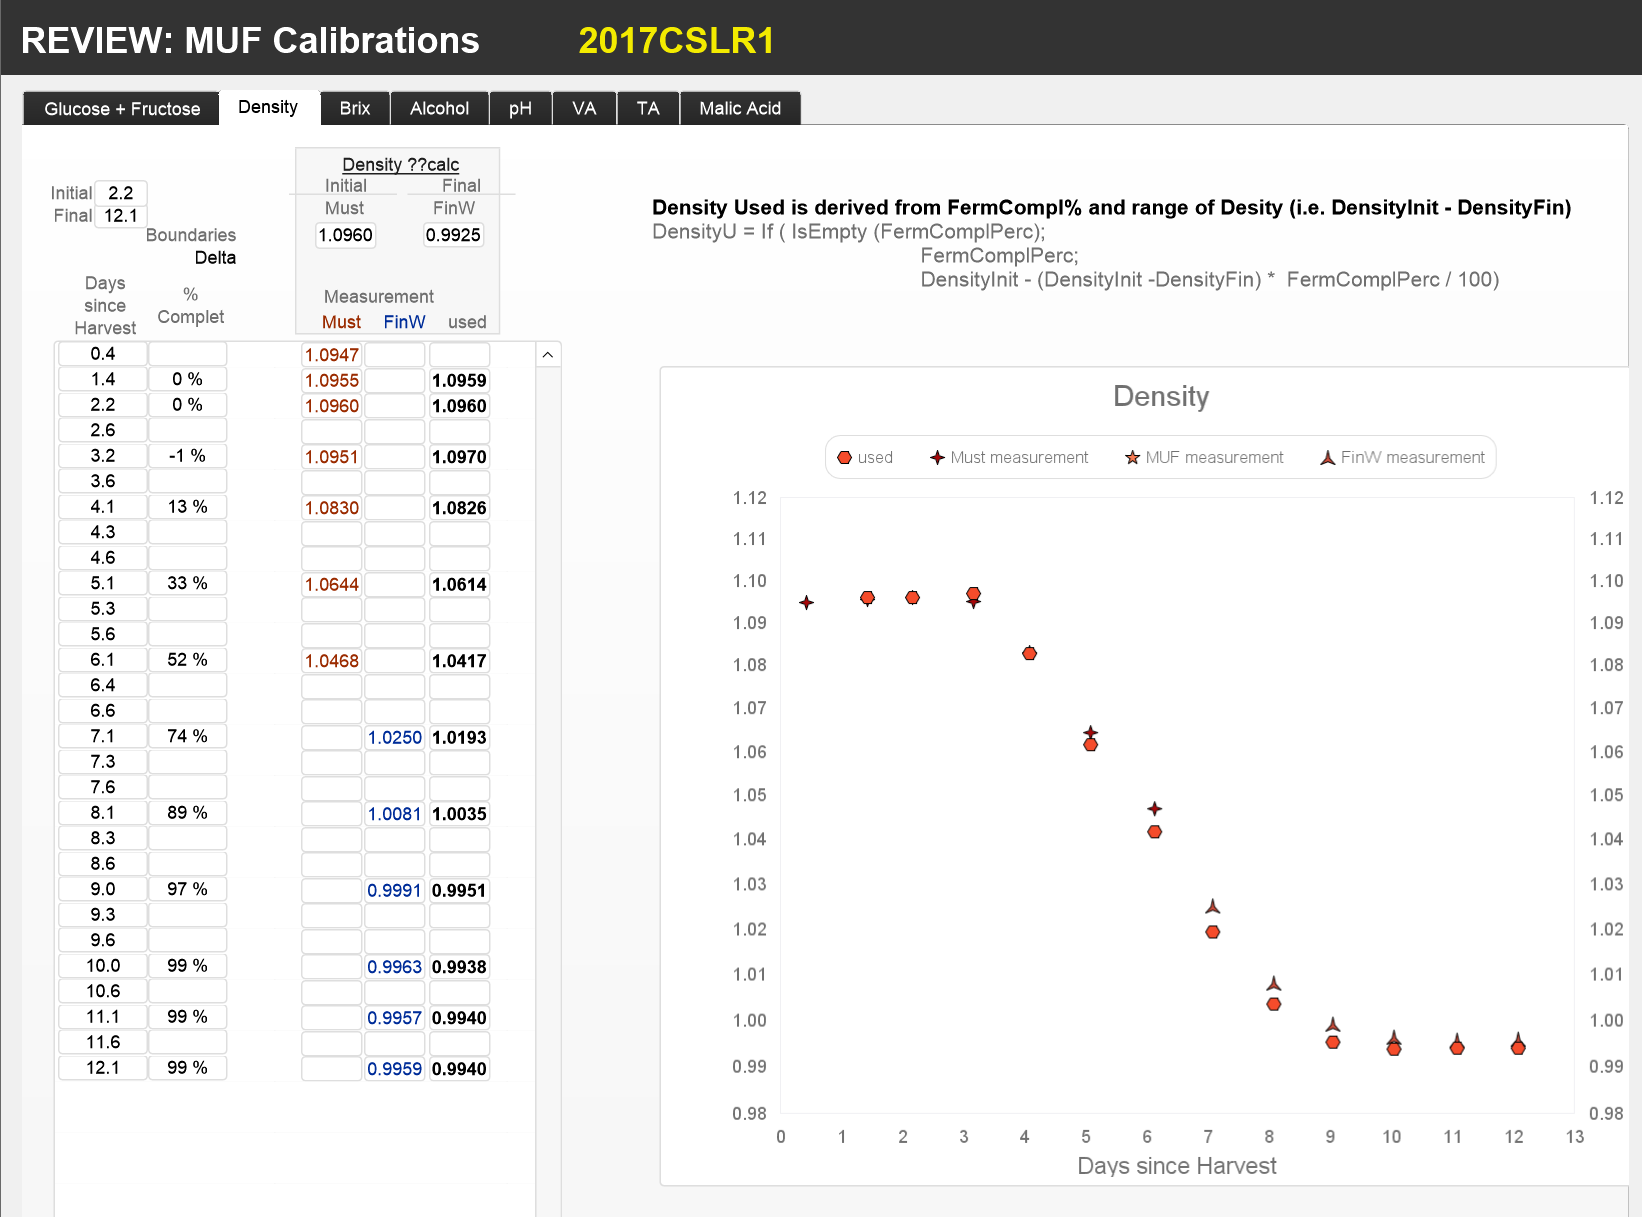
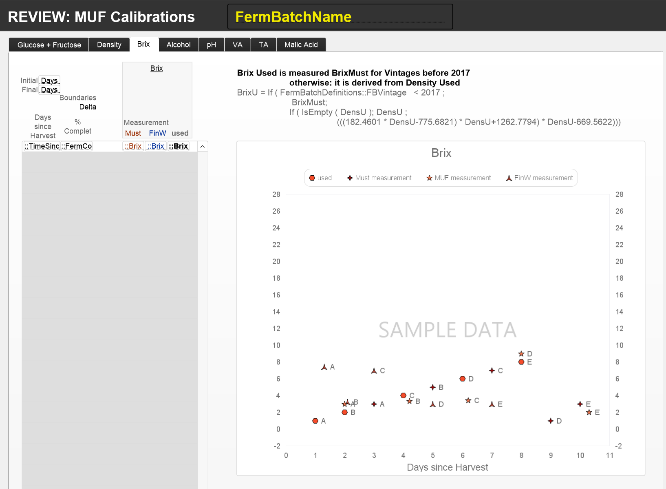
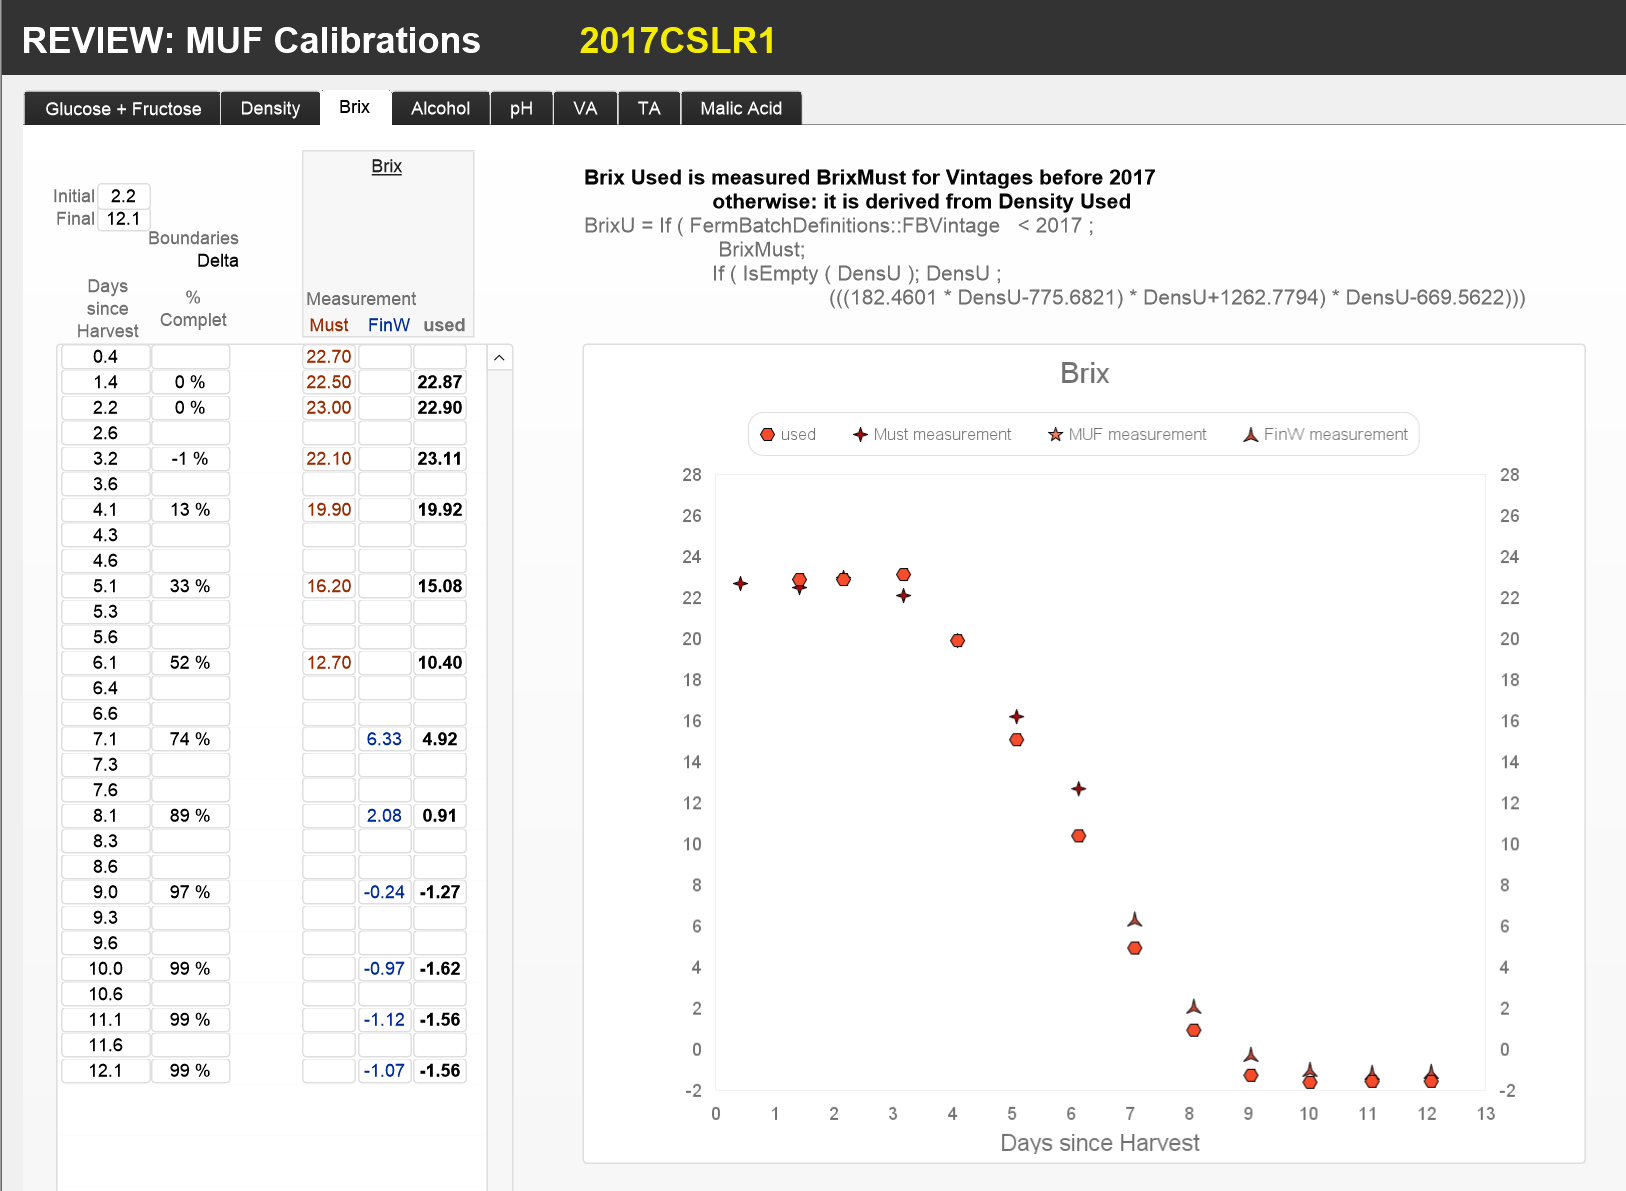
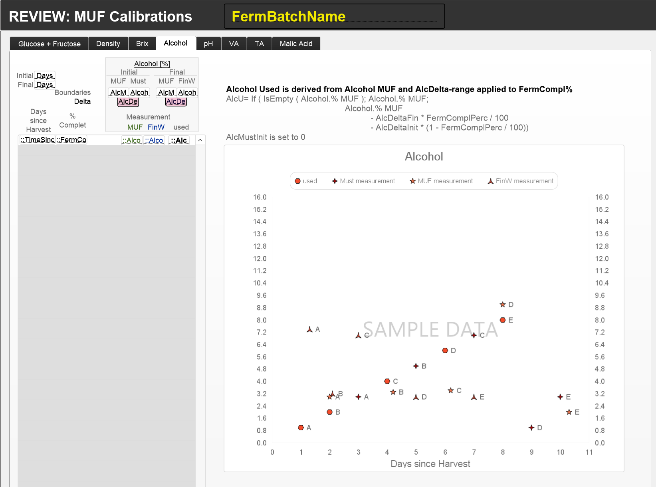
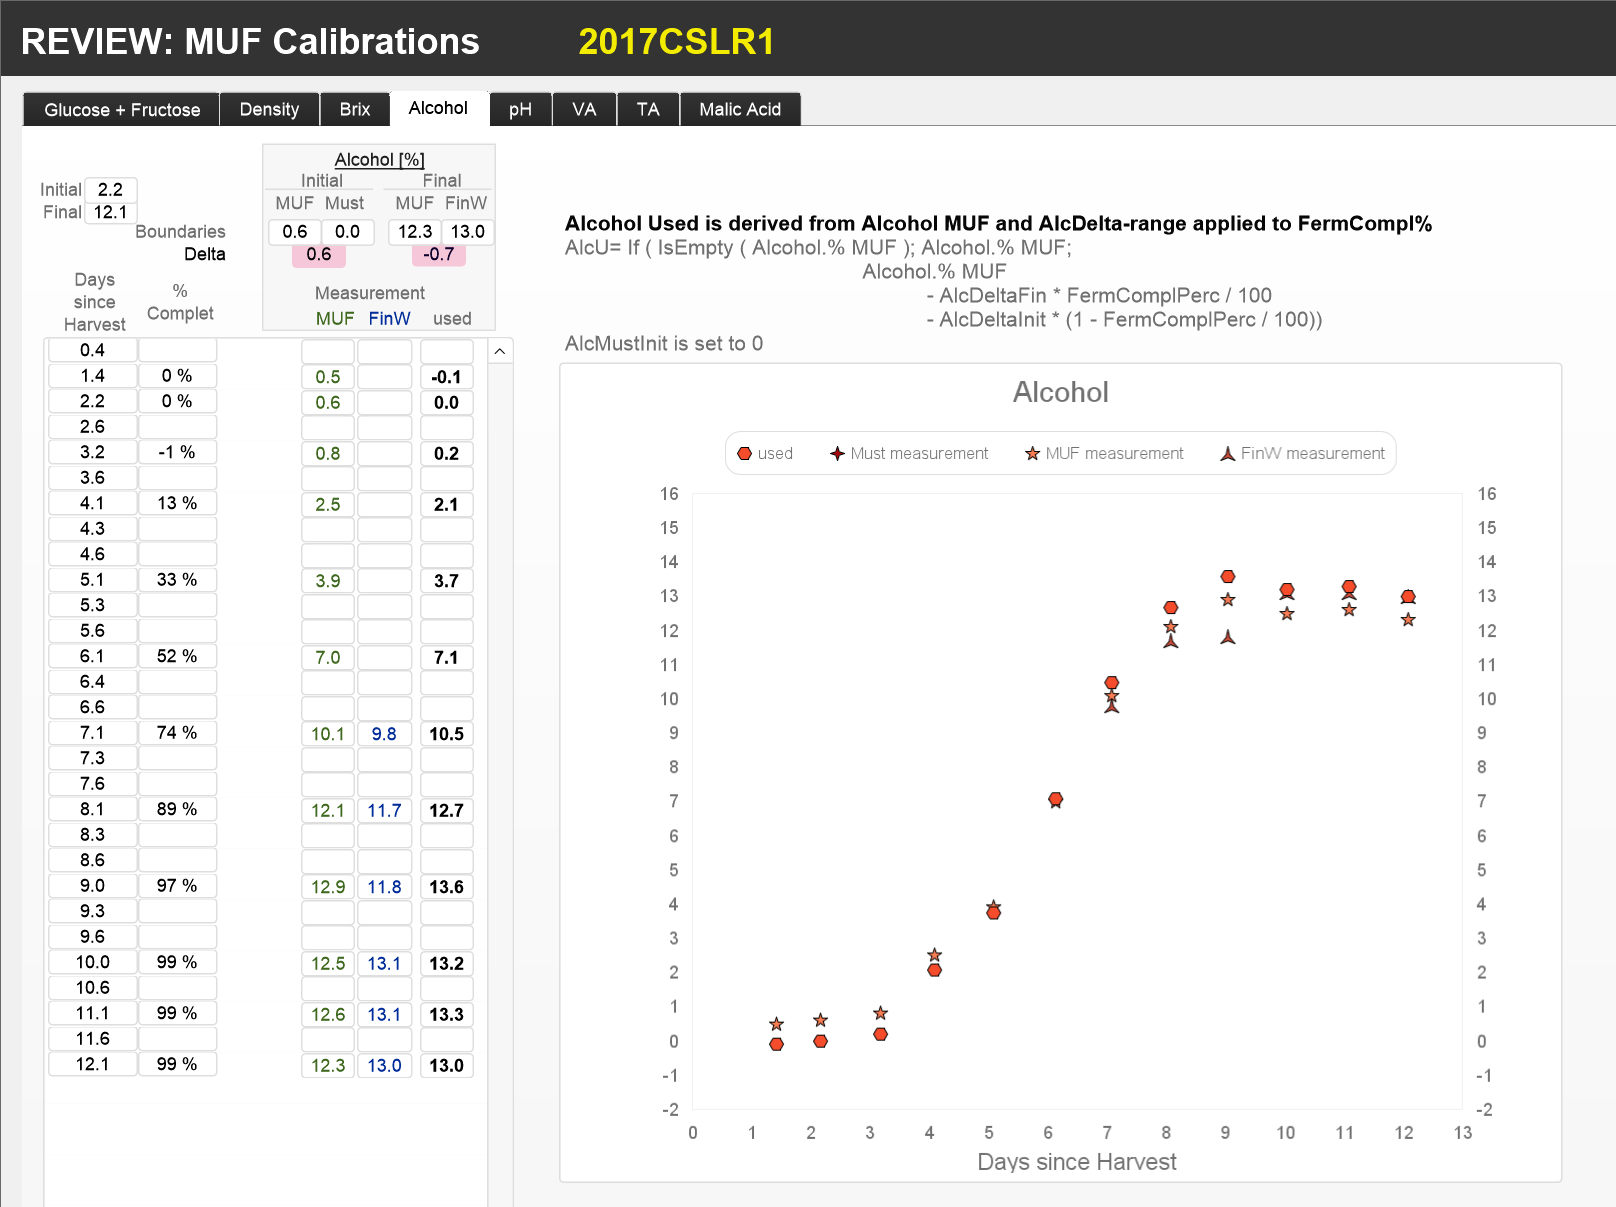
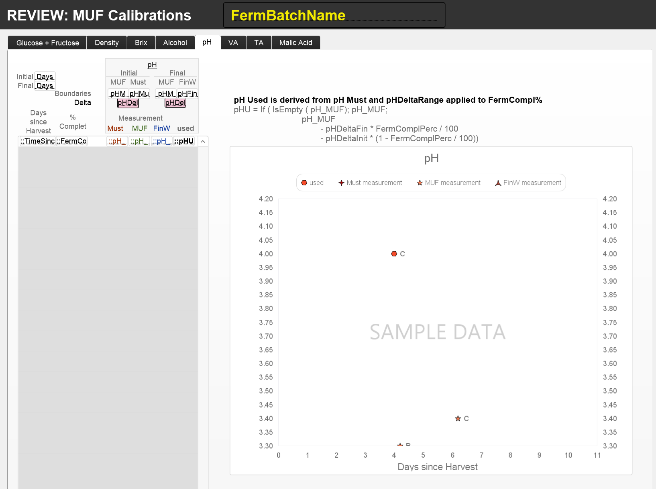
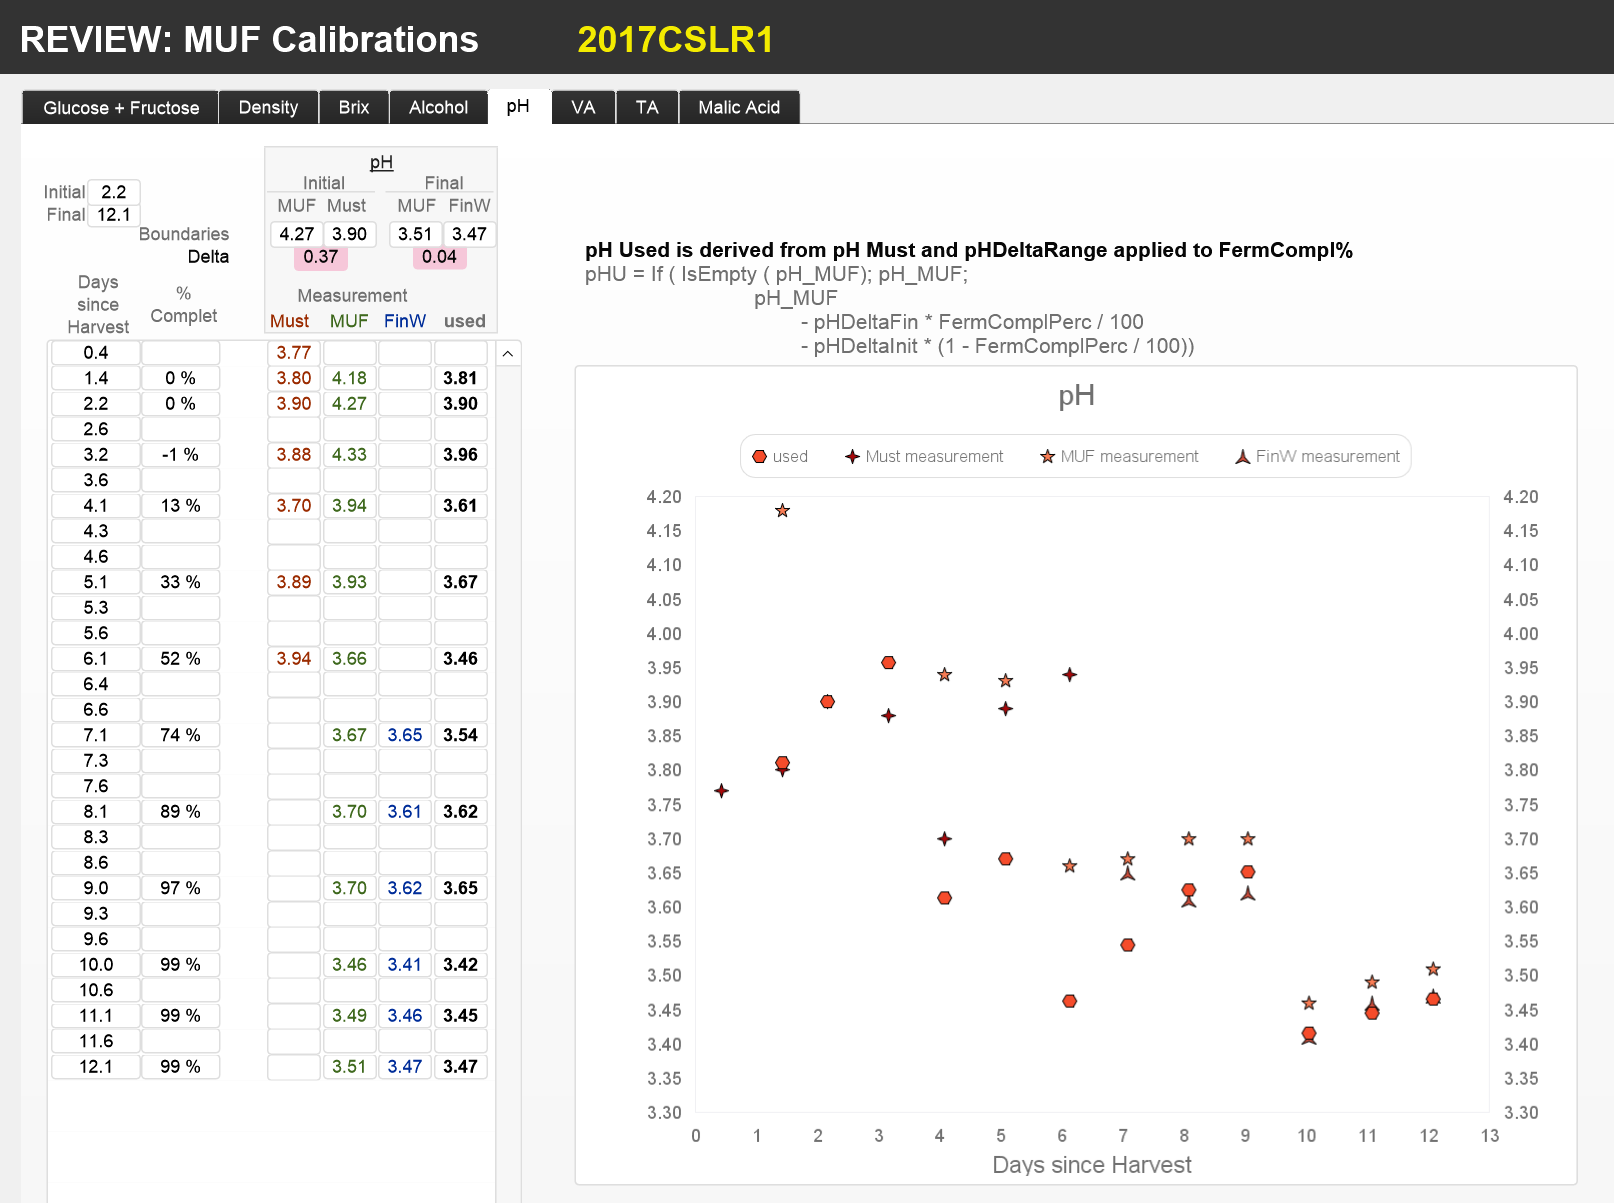
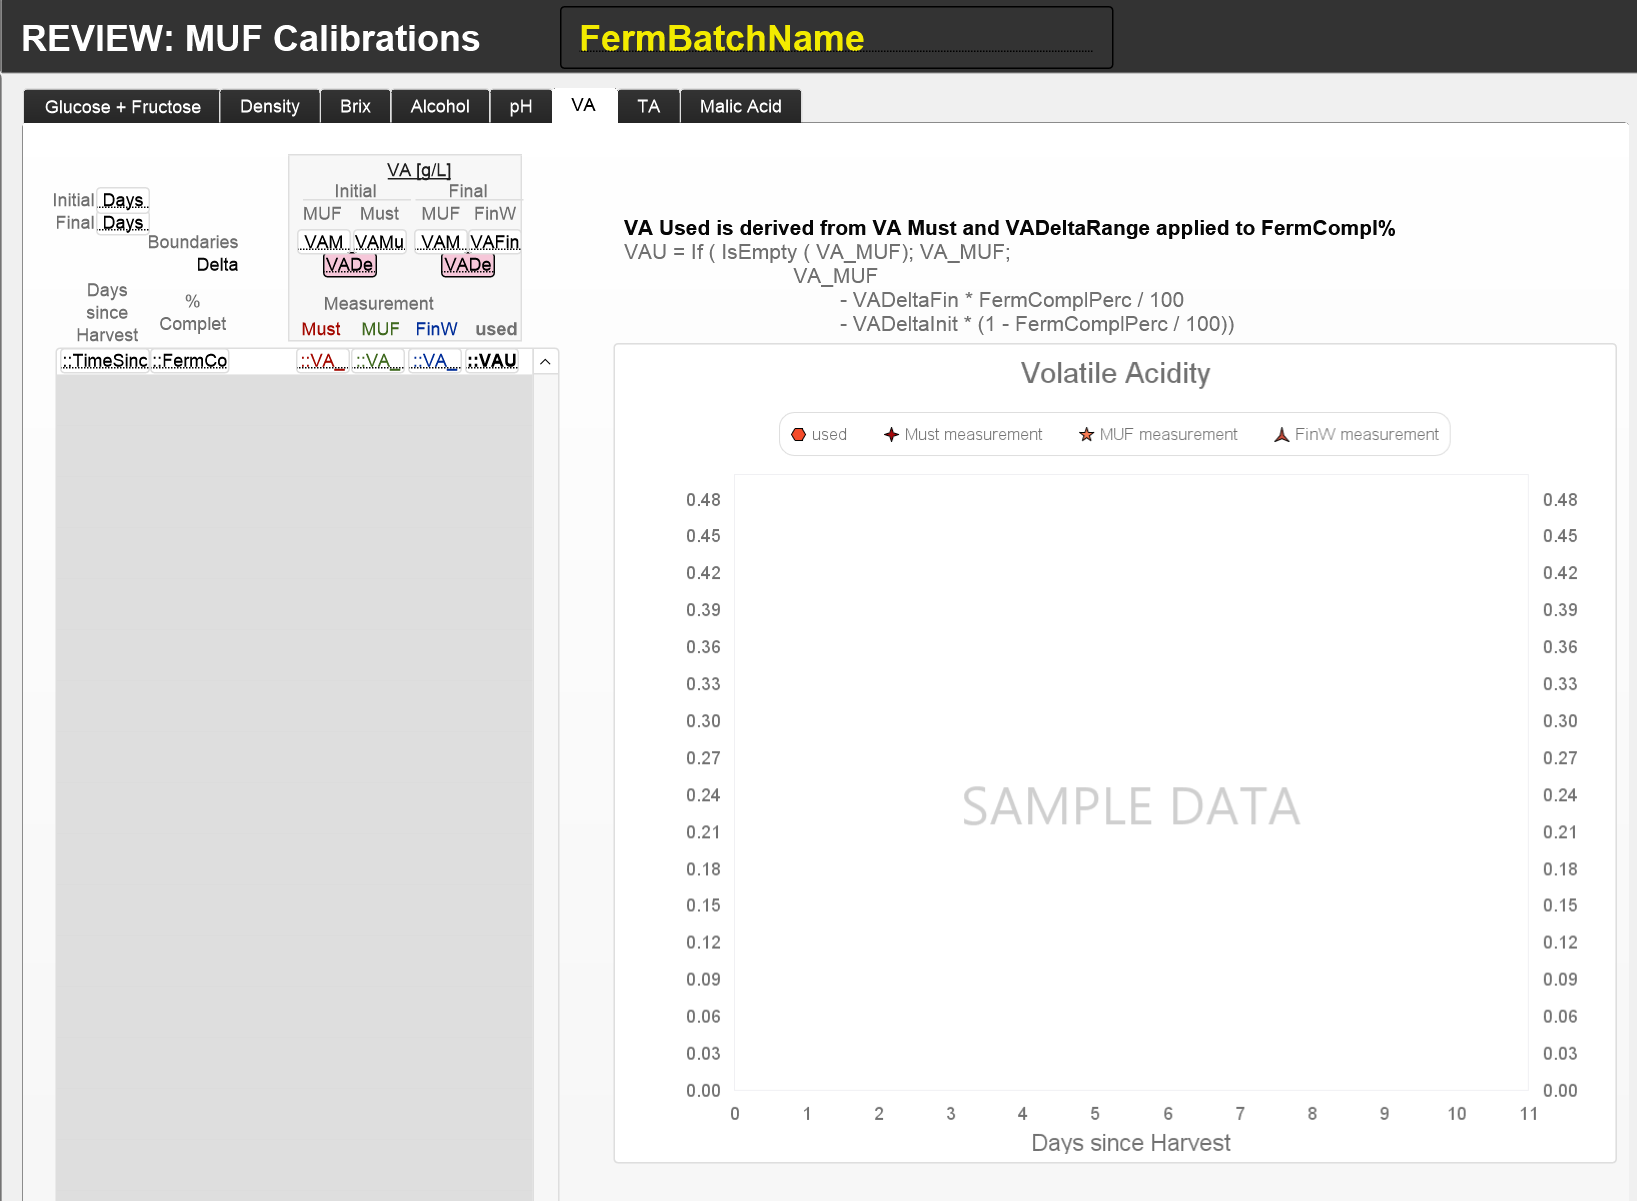
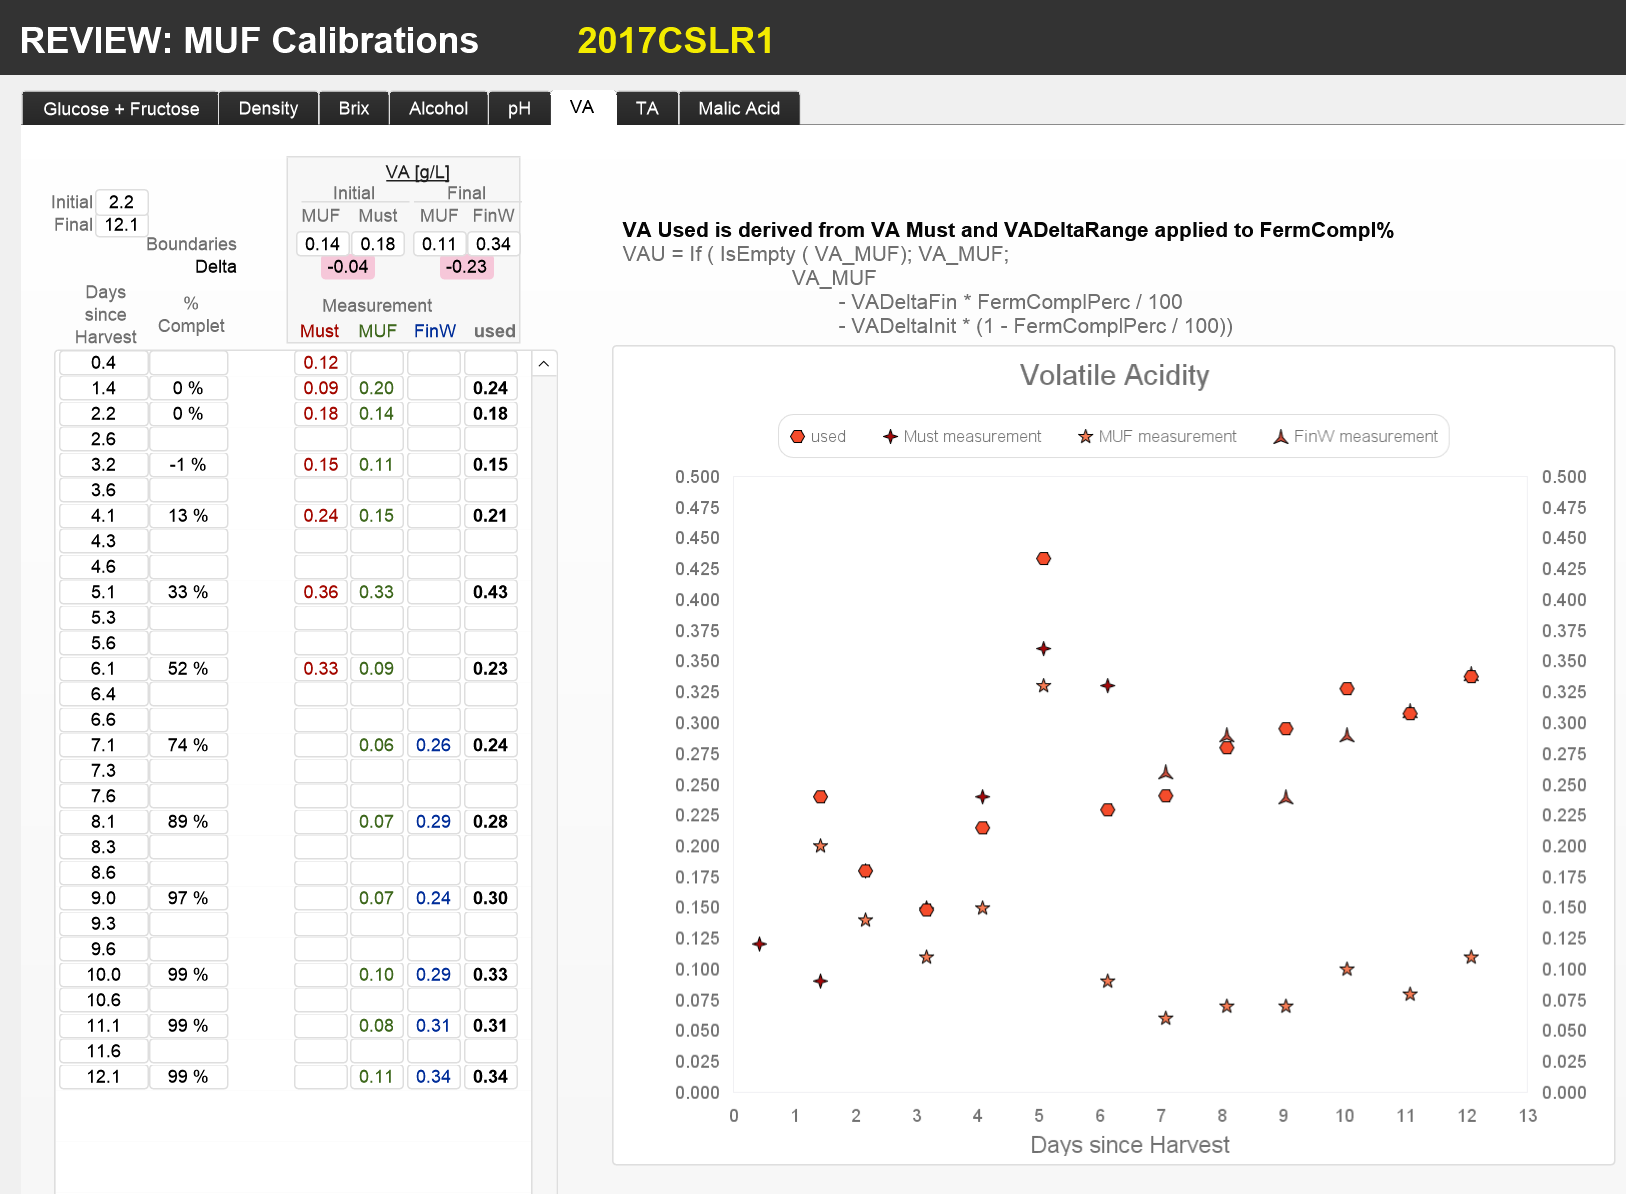
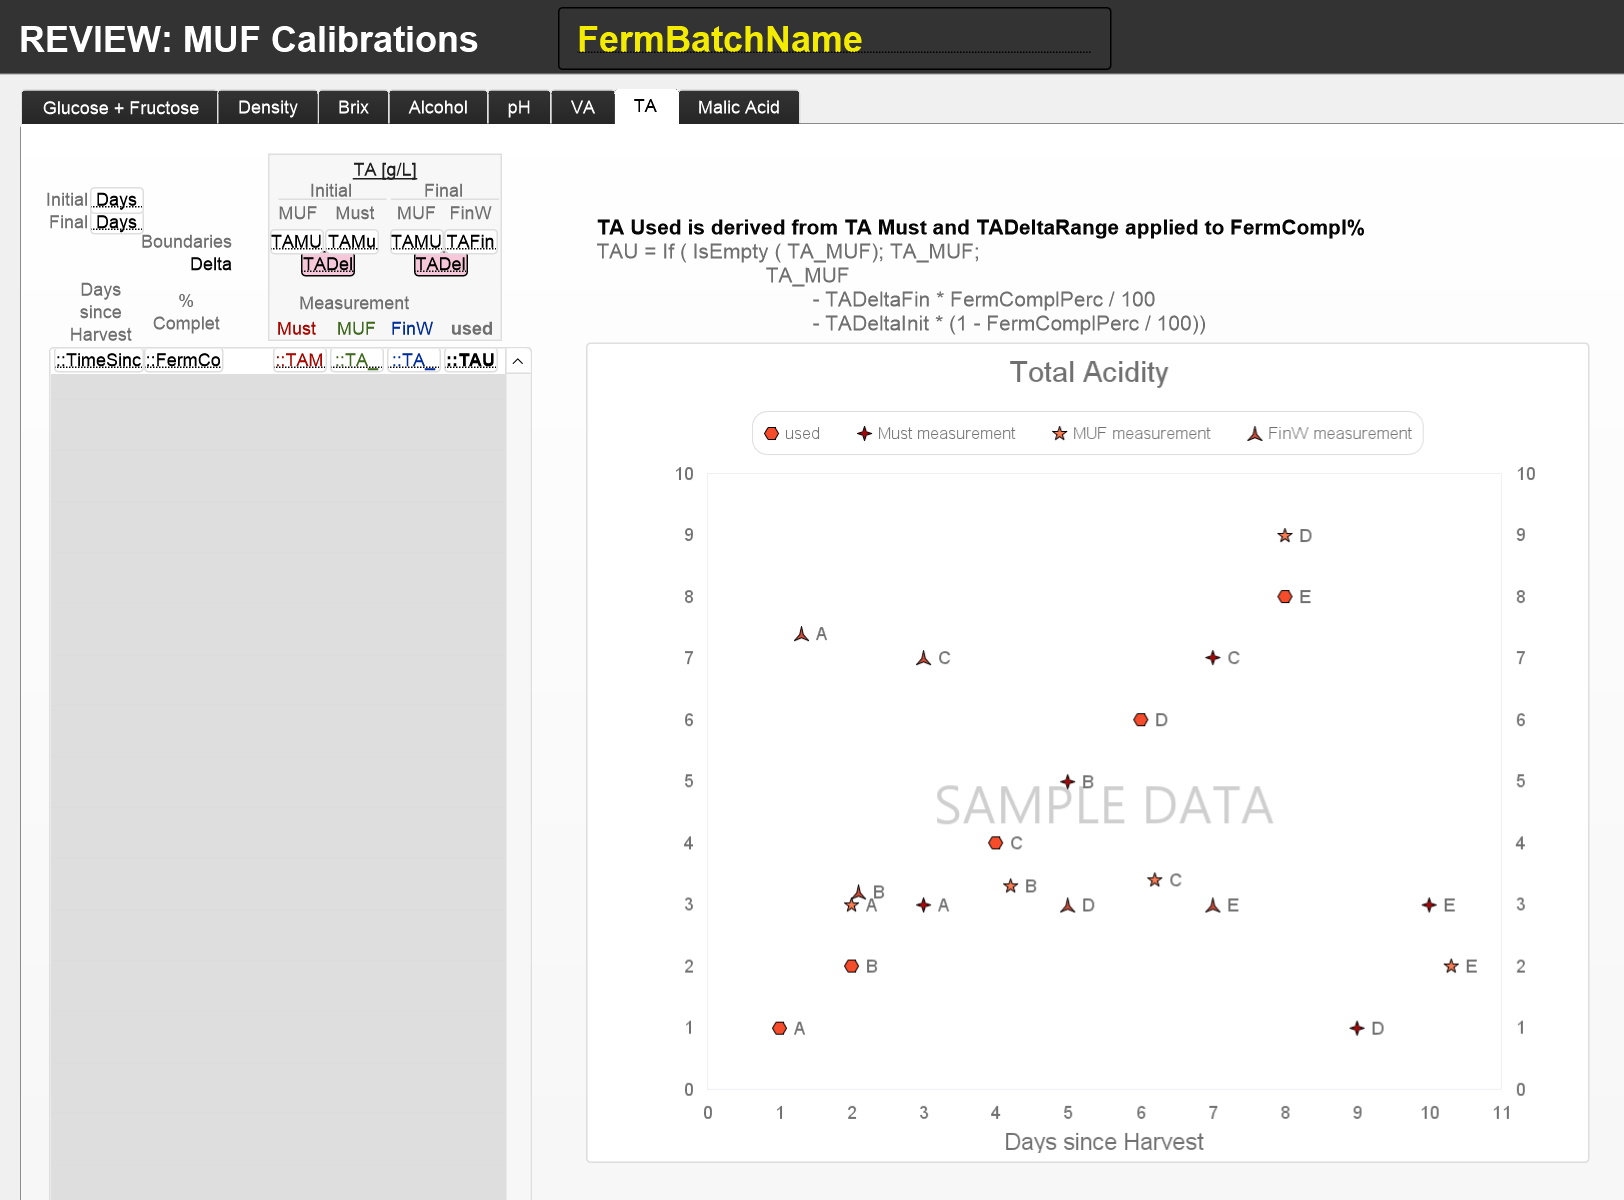
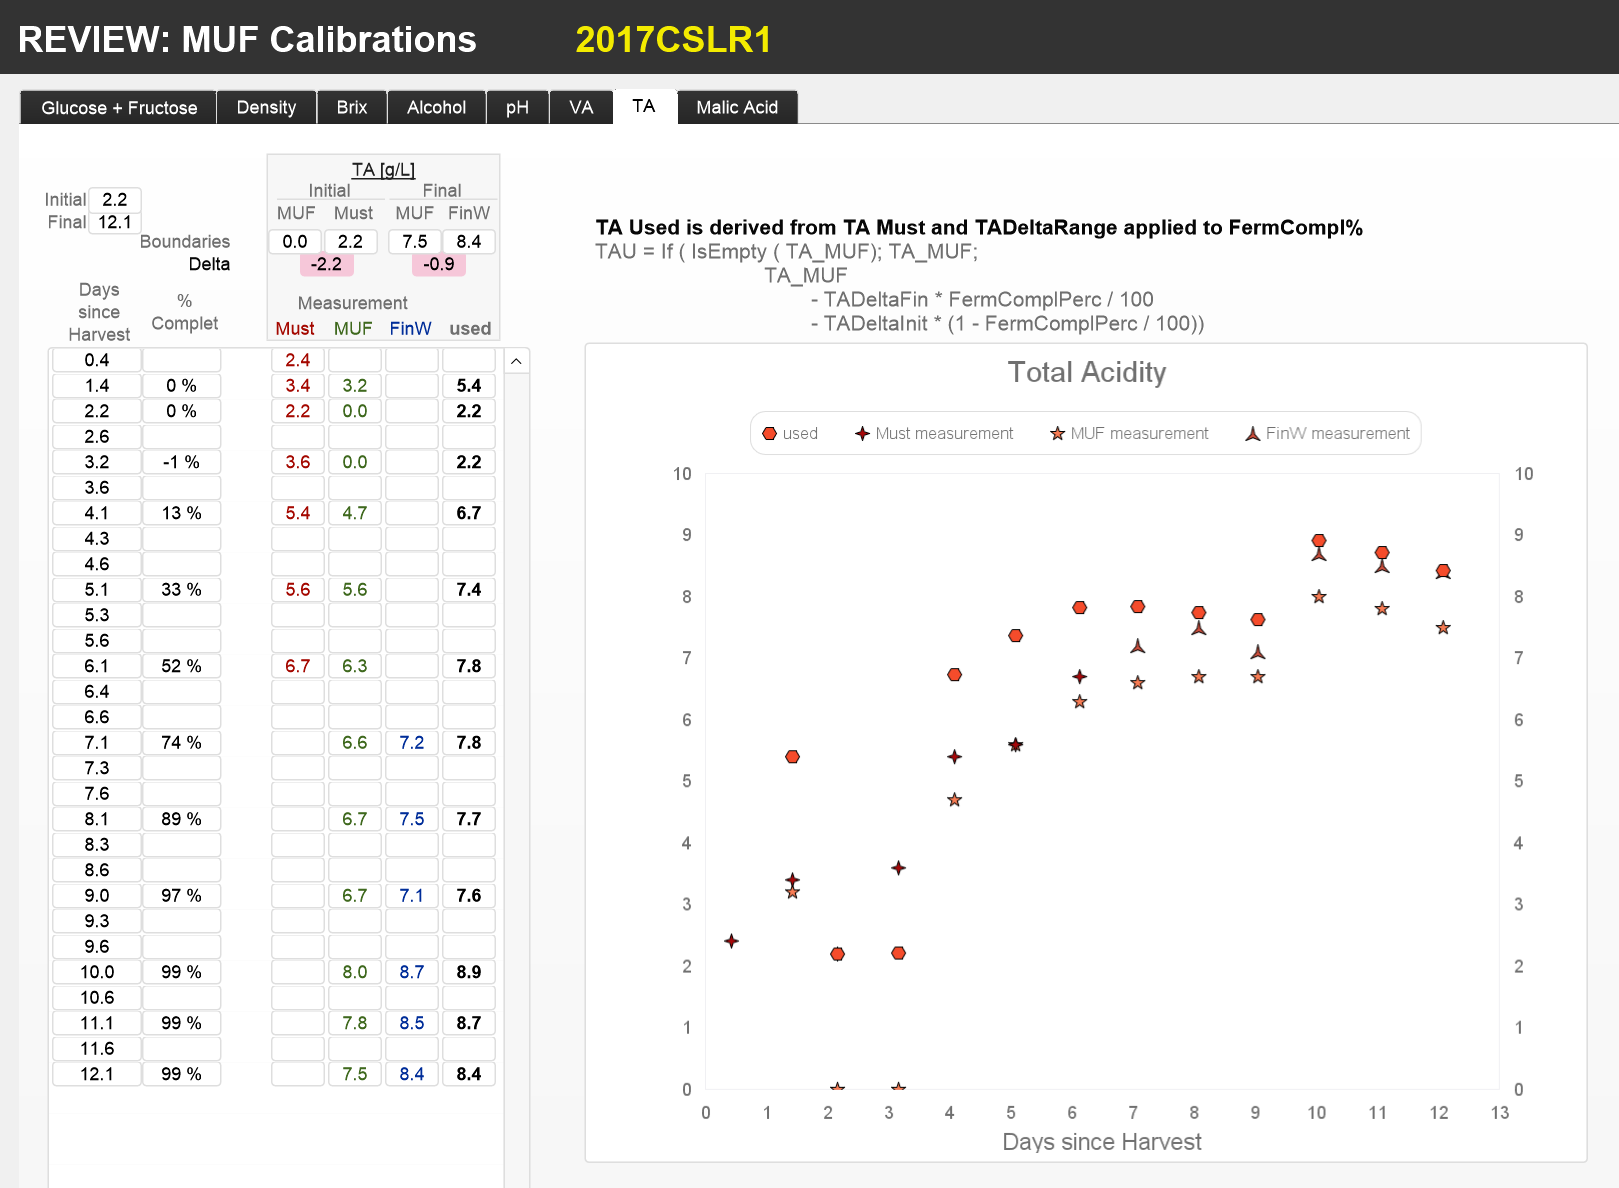
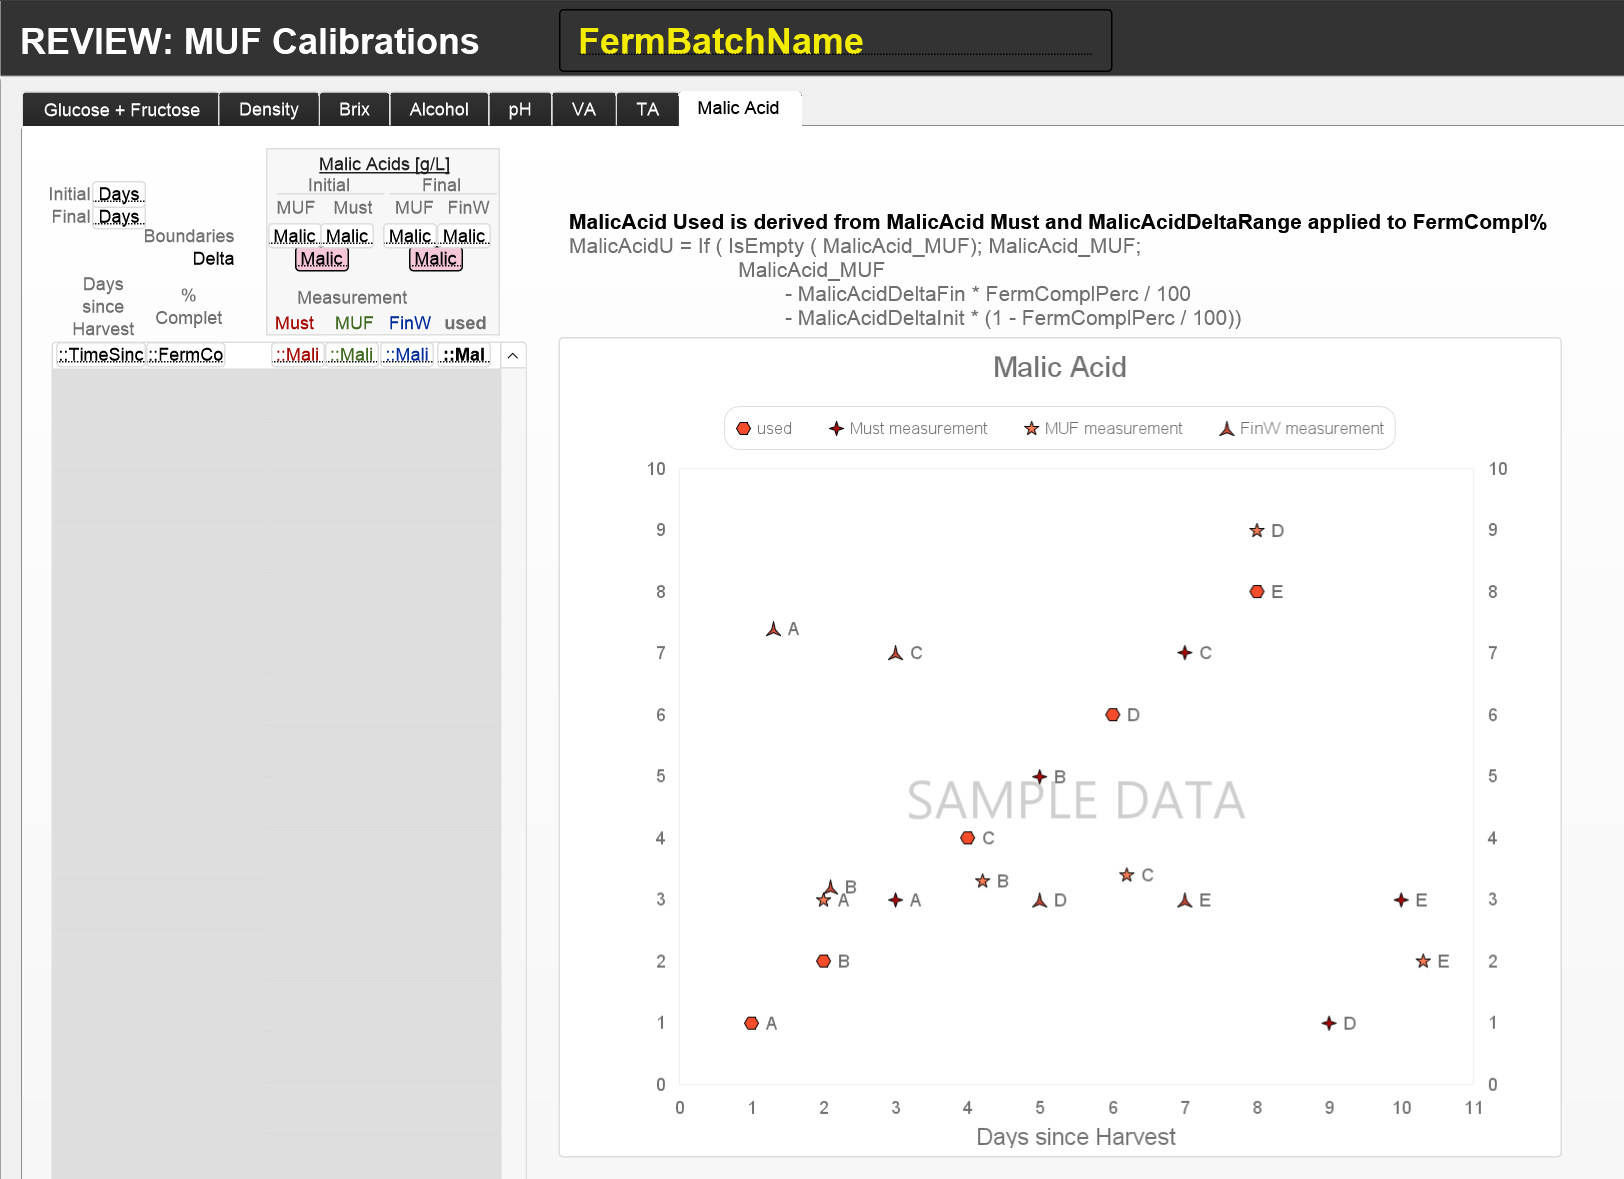
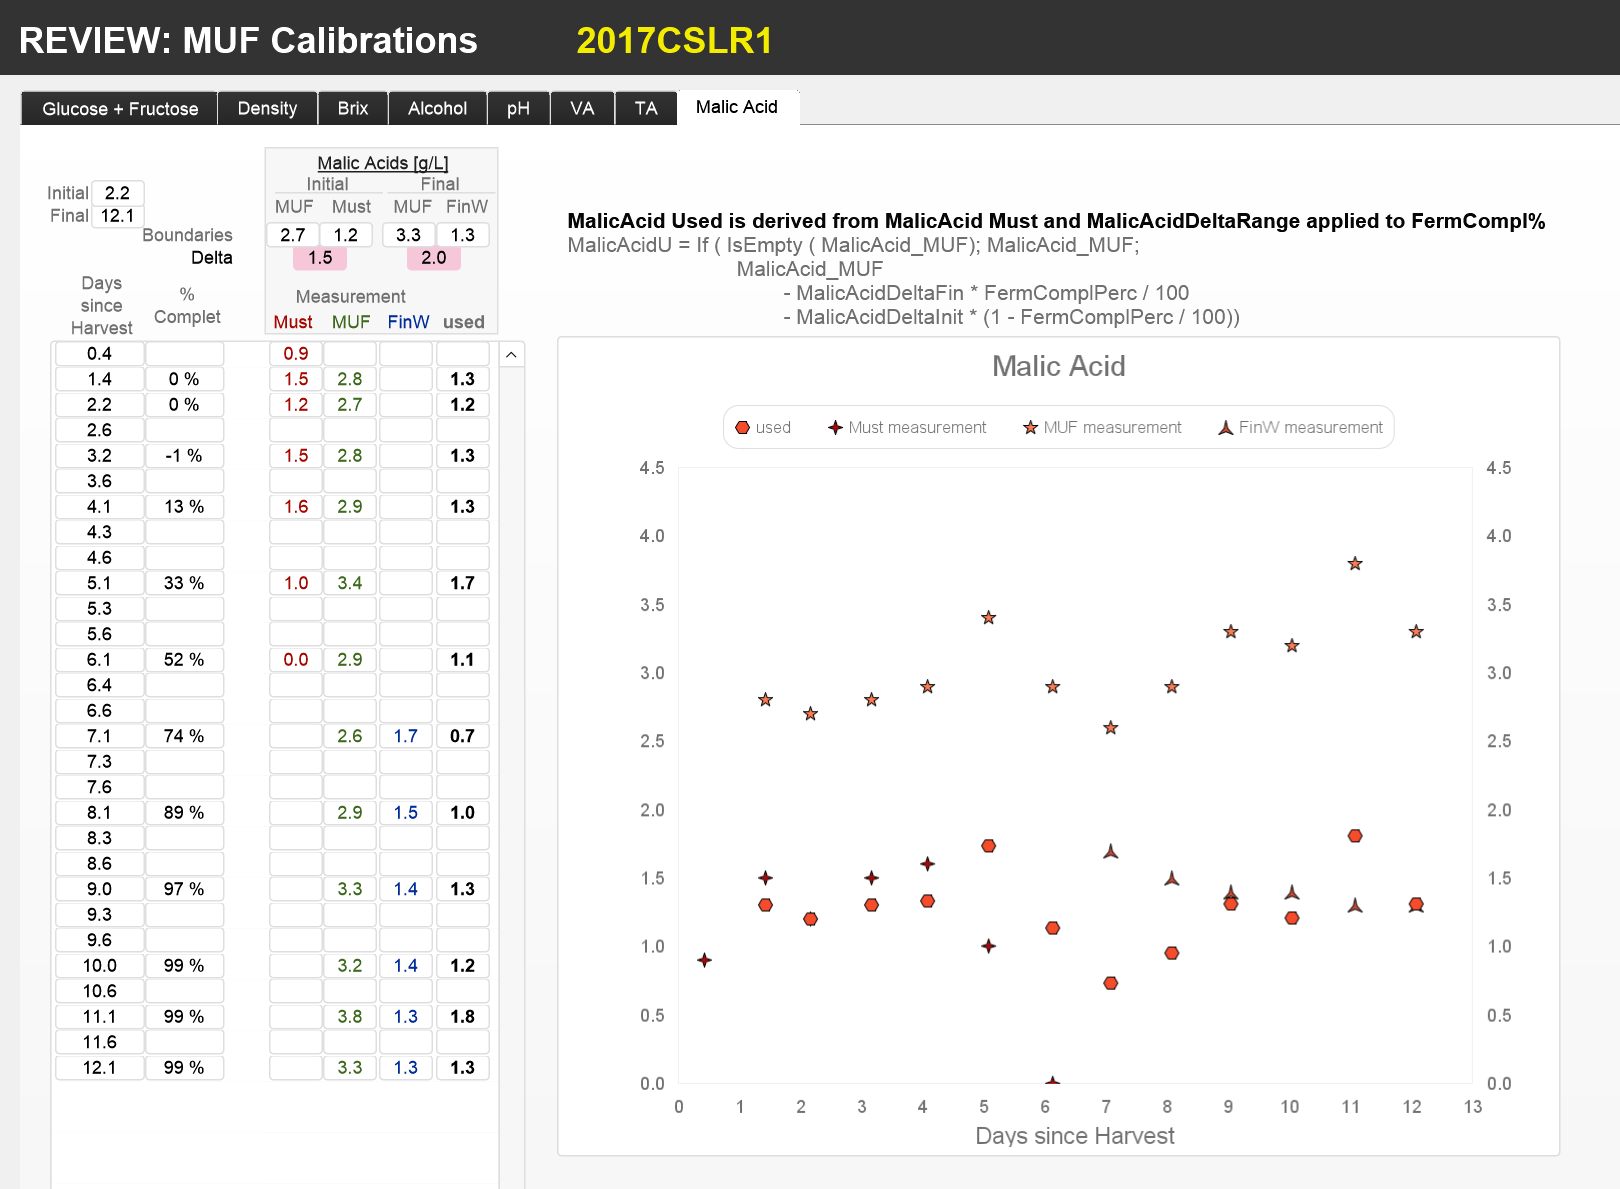
The layout has 8 tabs, one each for the Glucose+Fructose, Density, Brix, Alcohol, pH, VA, TA and Malic Acid measurements. The following screenshots show in sequence each of the tabs, first the layout with field names, then, for example, the layout for the MUF calibration of the 2017CSLR1 fermentation batch.
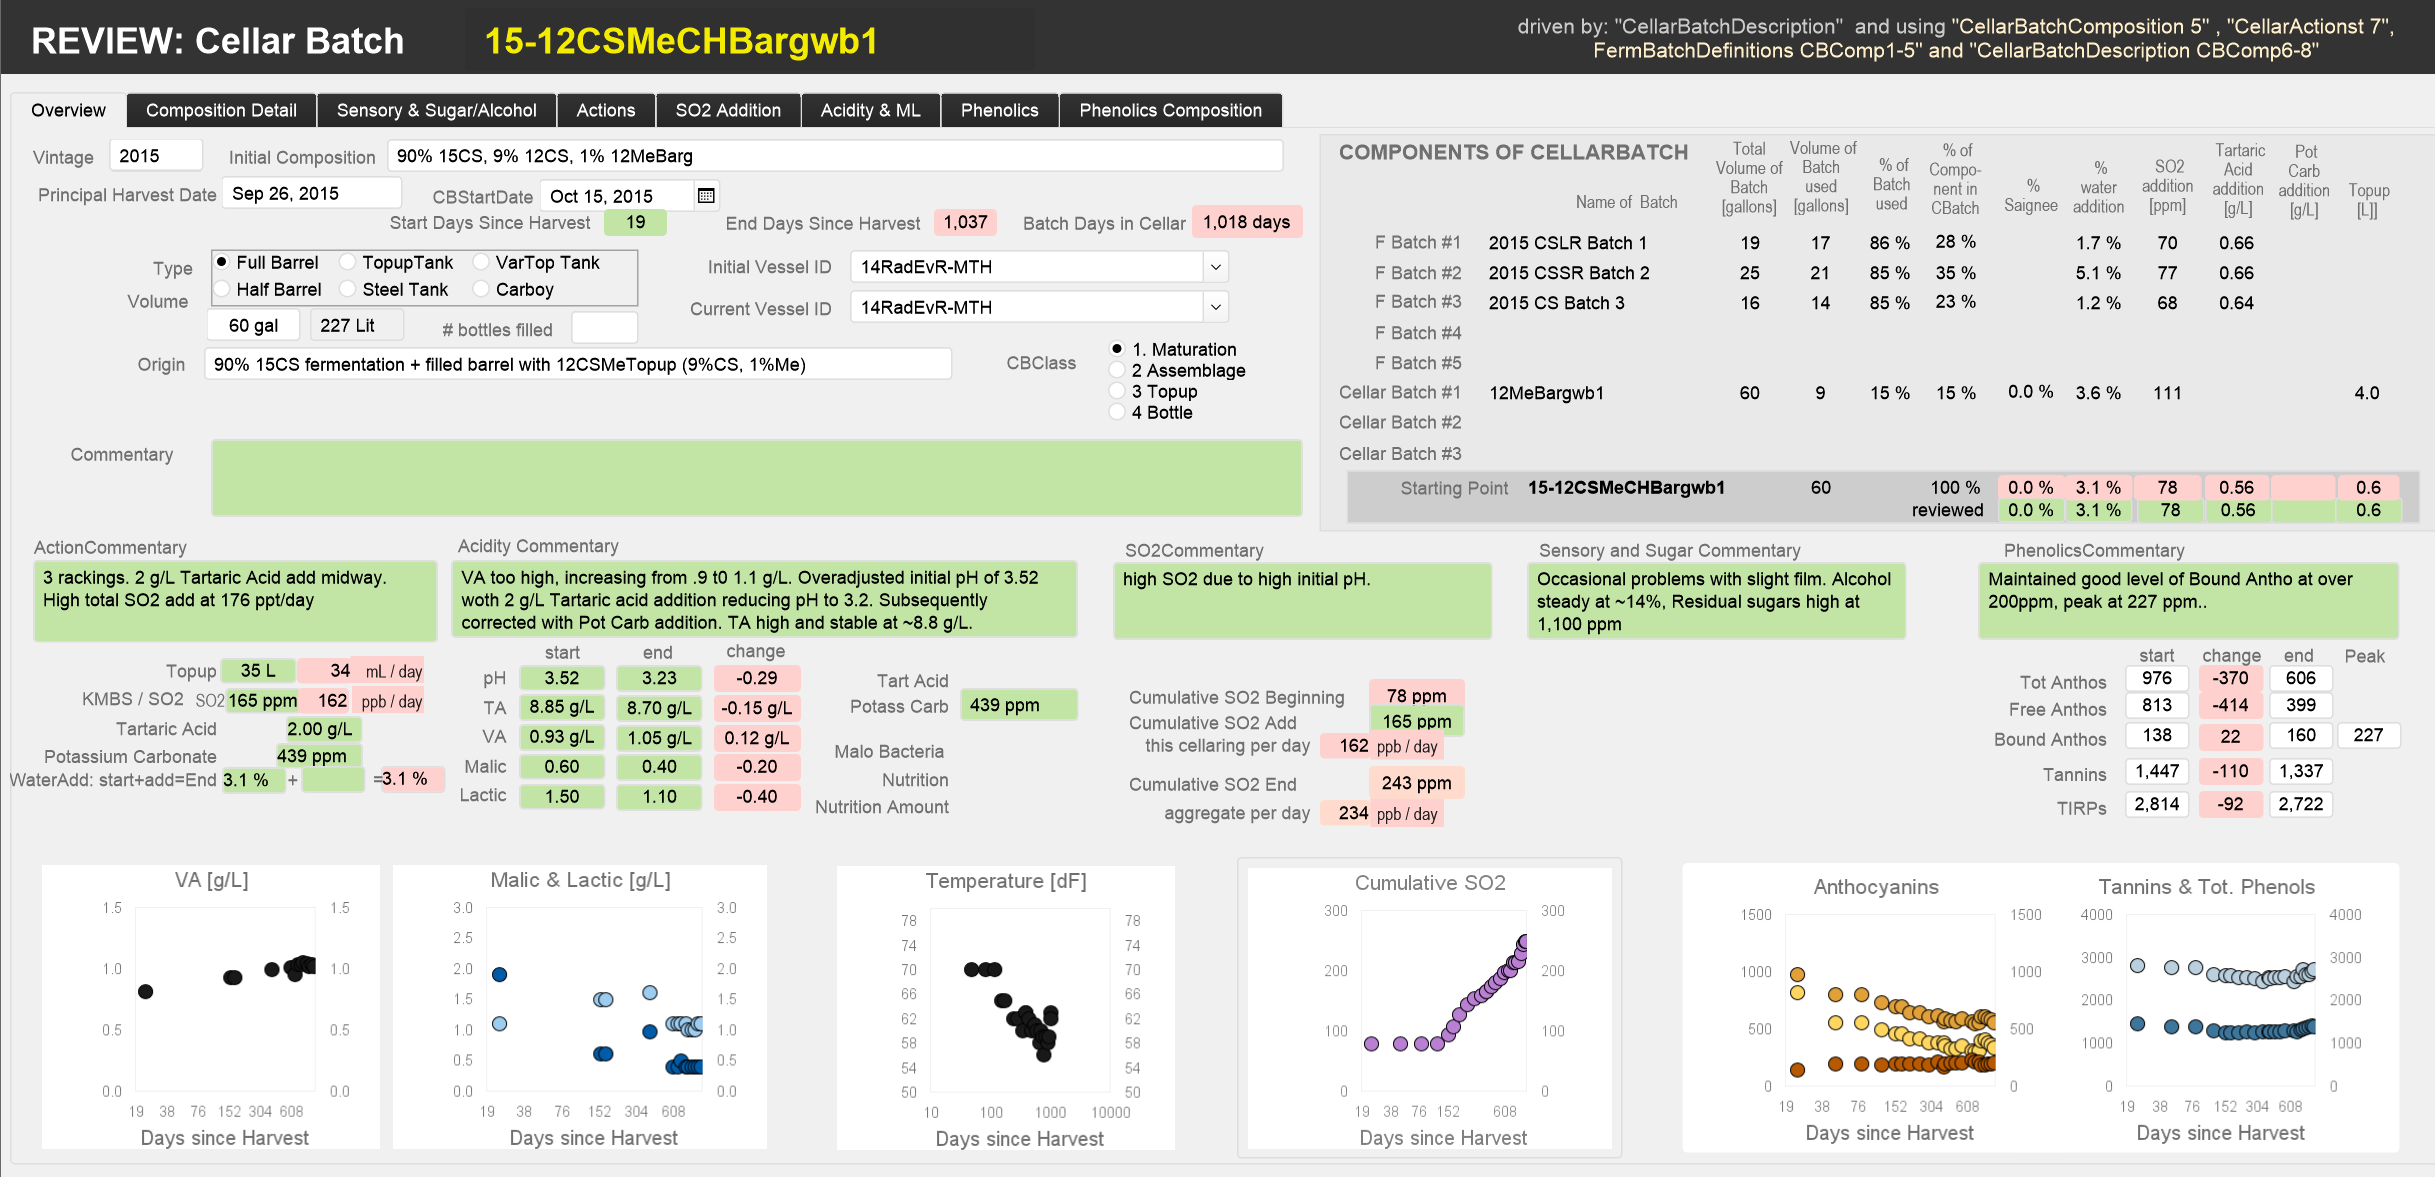
REVIEW: Cellar Batch
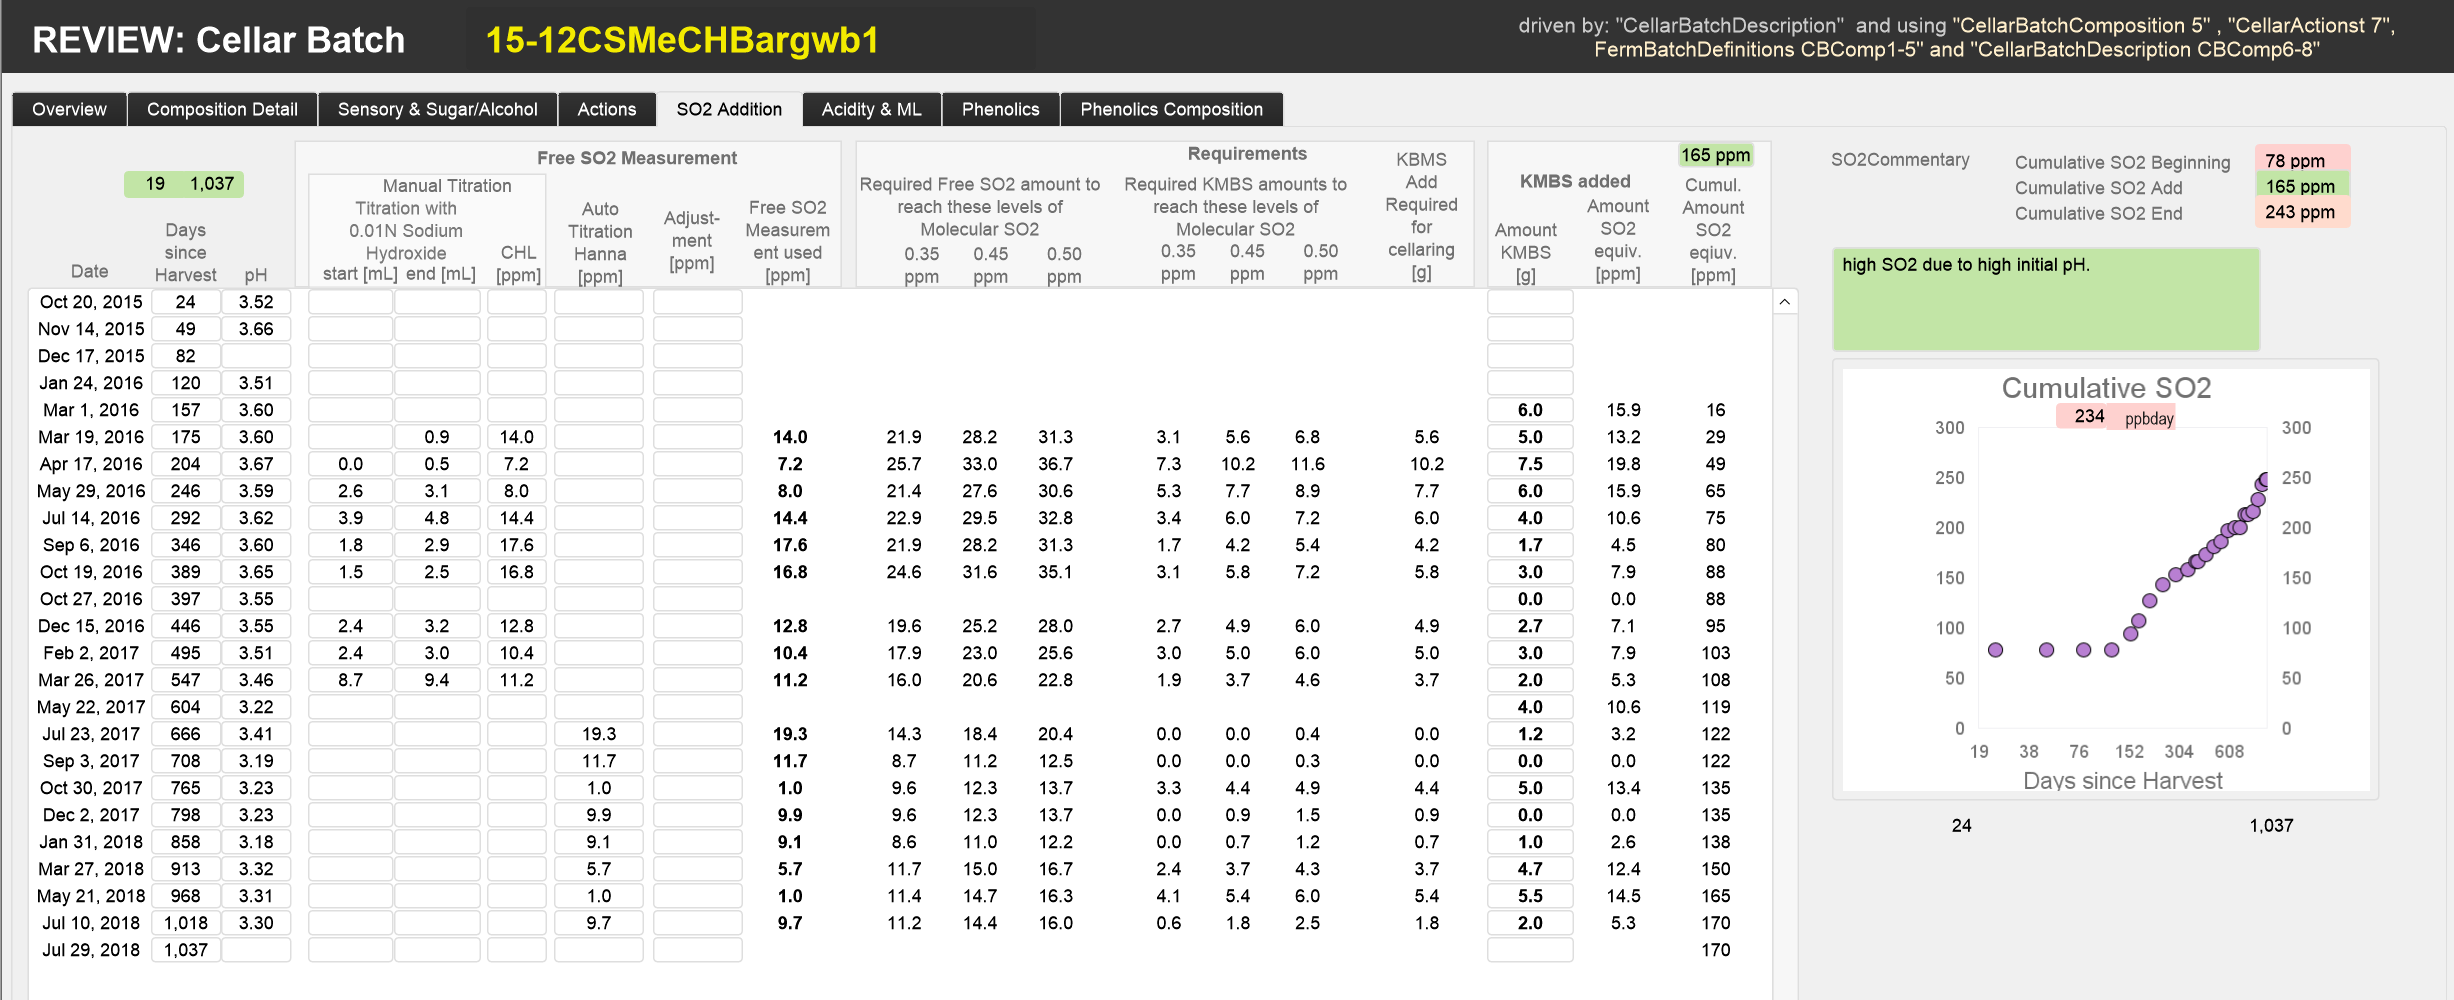
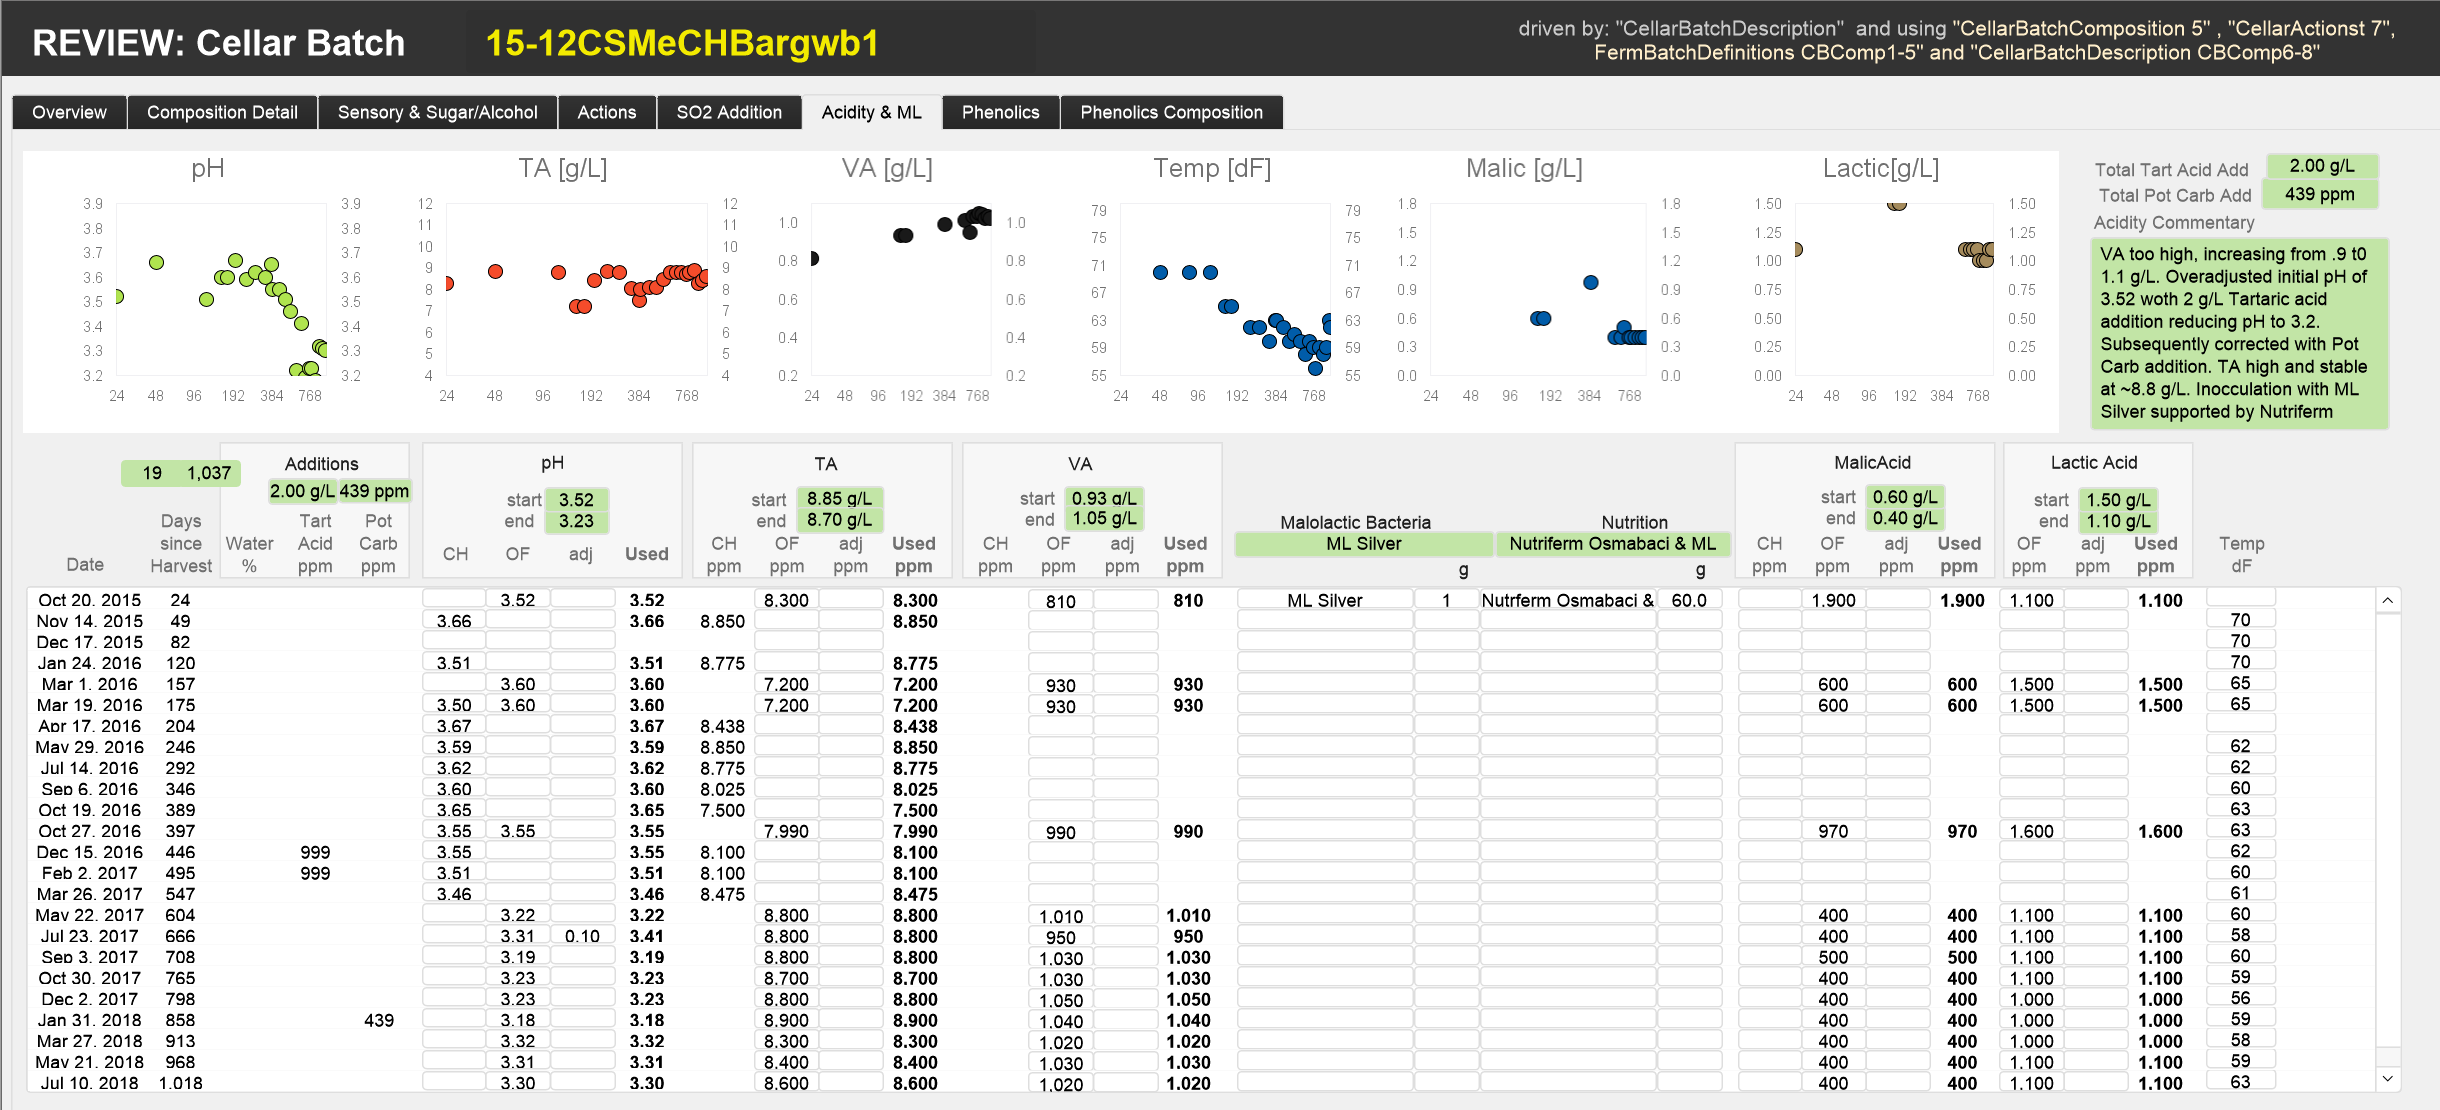
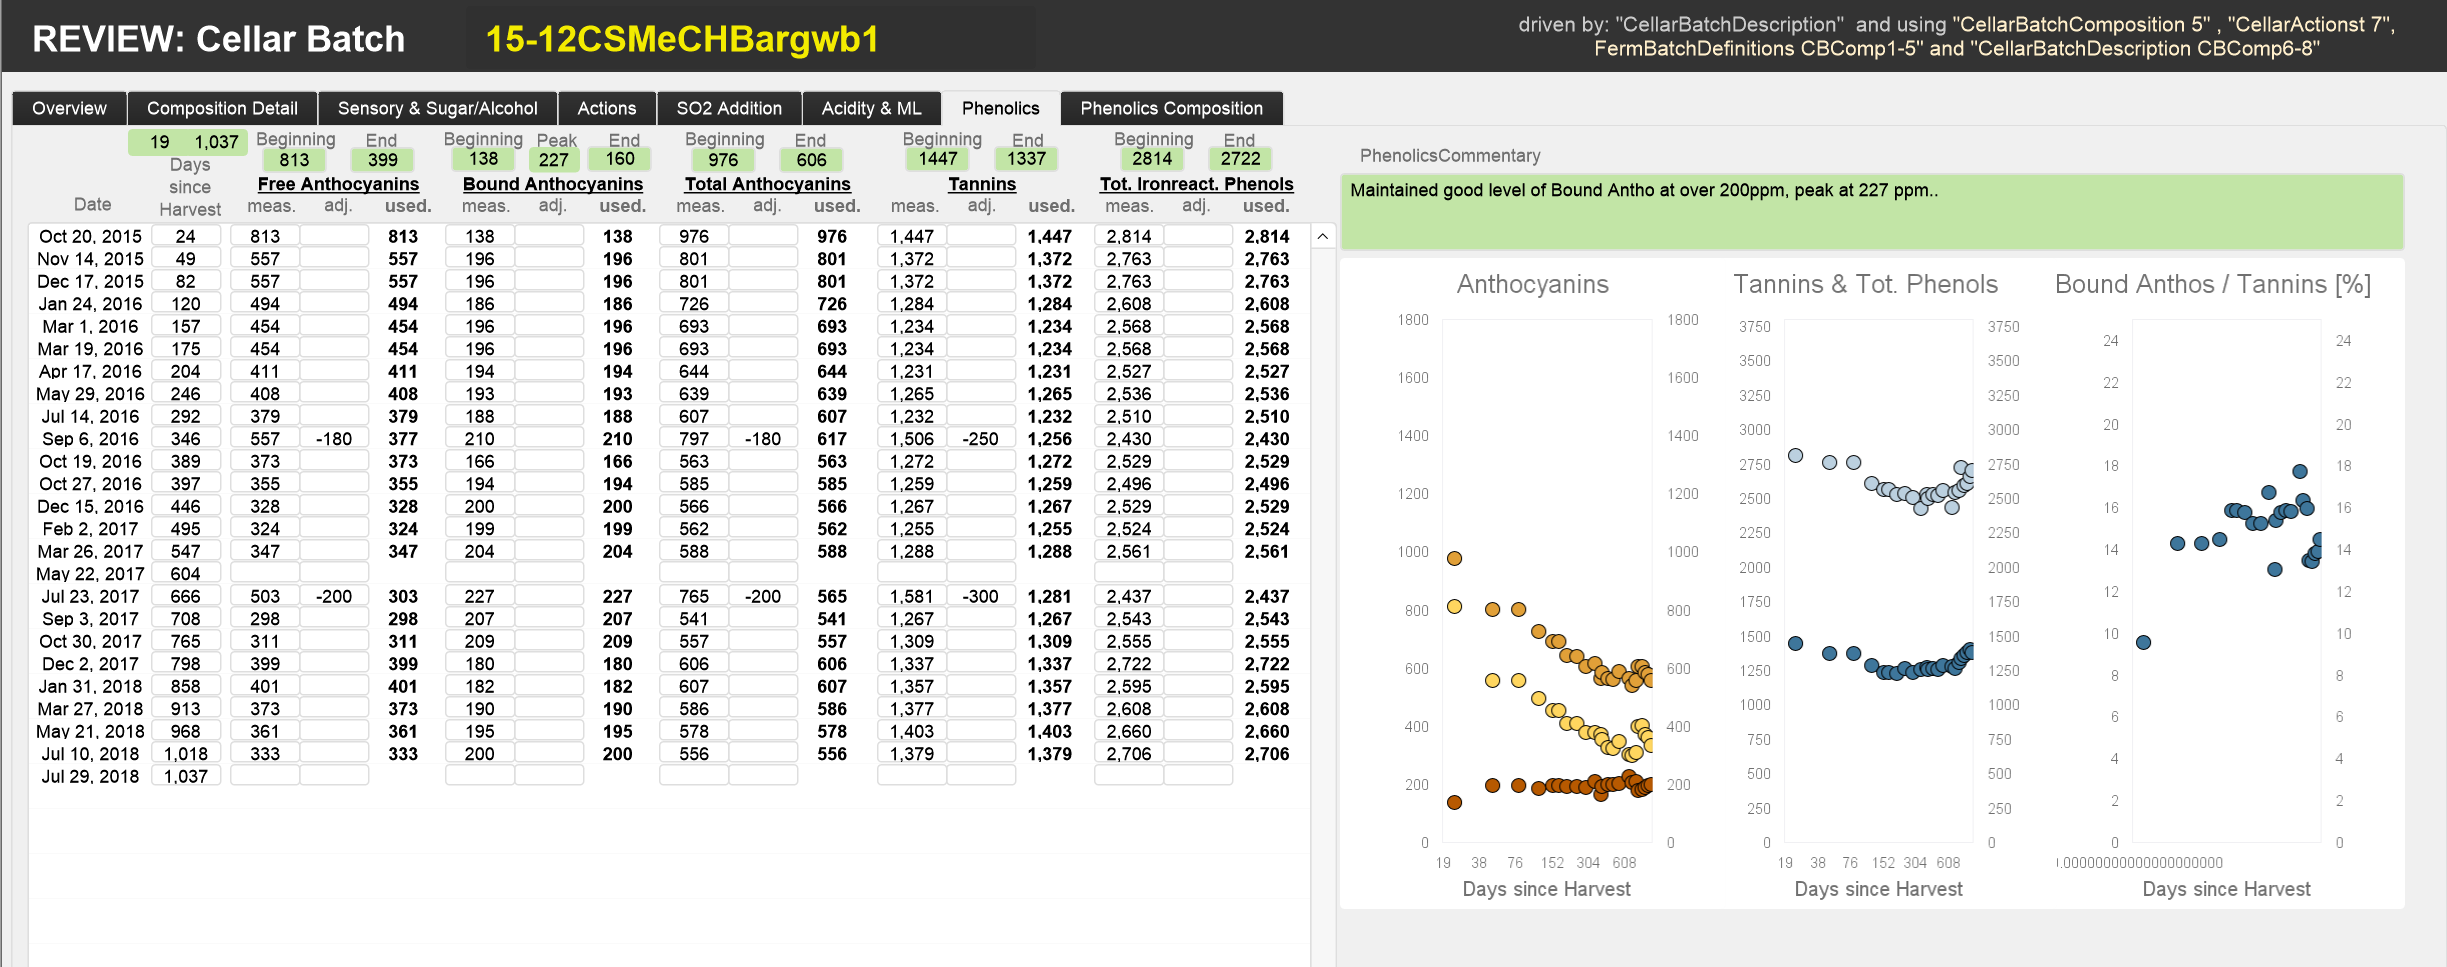
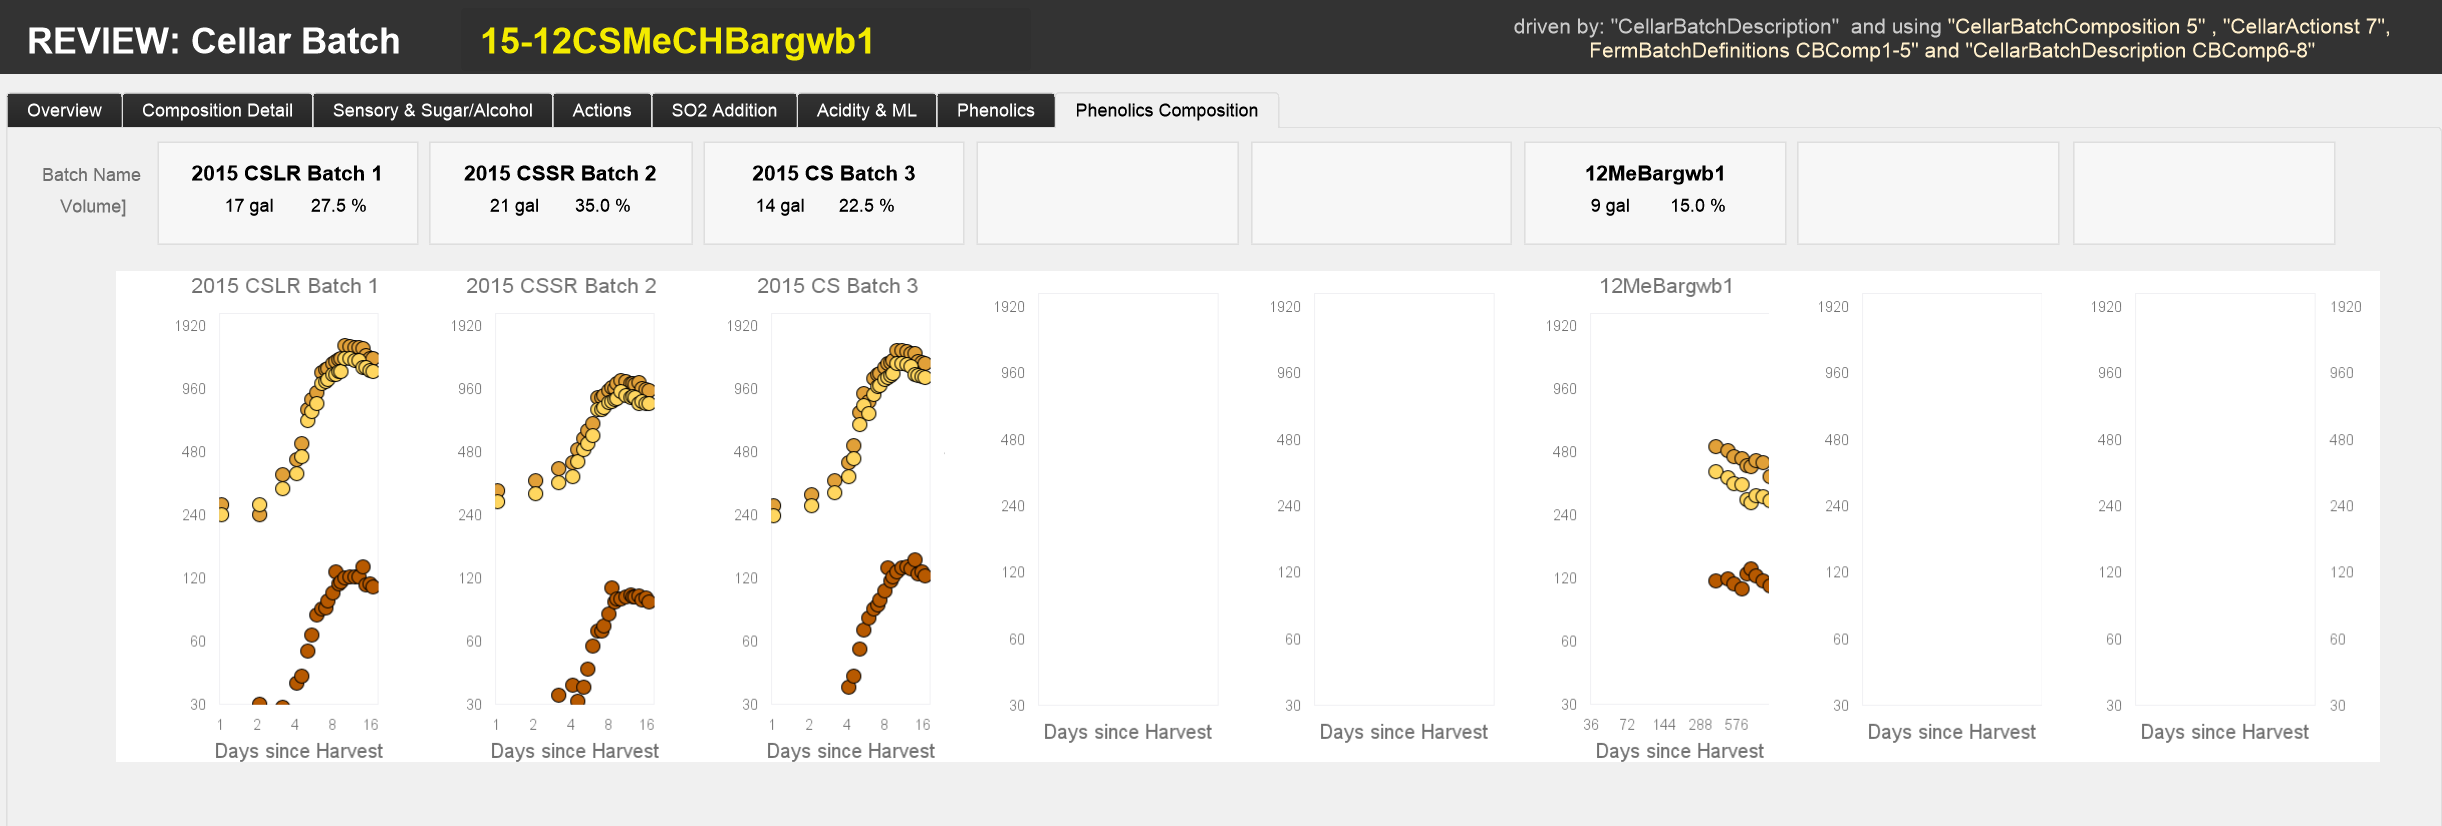
The REVIEW: Cellar Batch layout pulls together all the data collected during the multi-year cellaring process of a given cellar batch. We use it to review each cellar batch at the time it is bottled or before it is mixed with other cellar batches. During the review, we enter aggregate data and add commentaries (green fields in screenshots which follow).
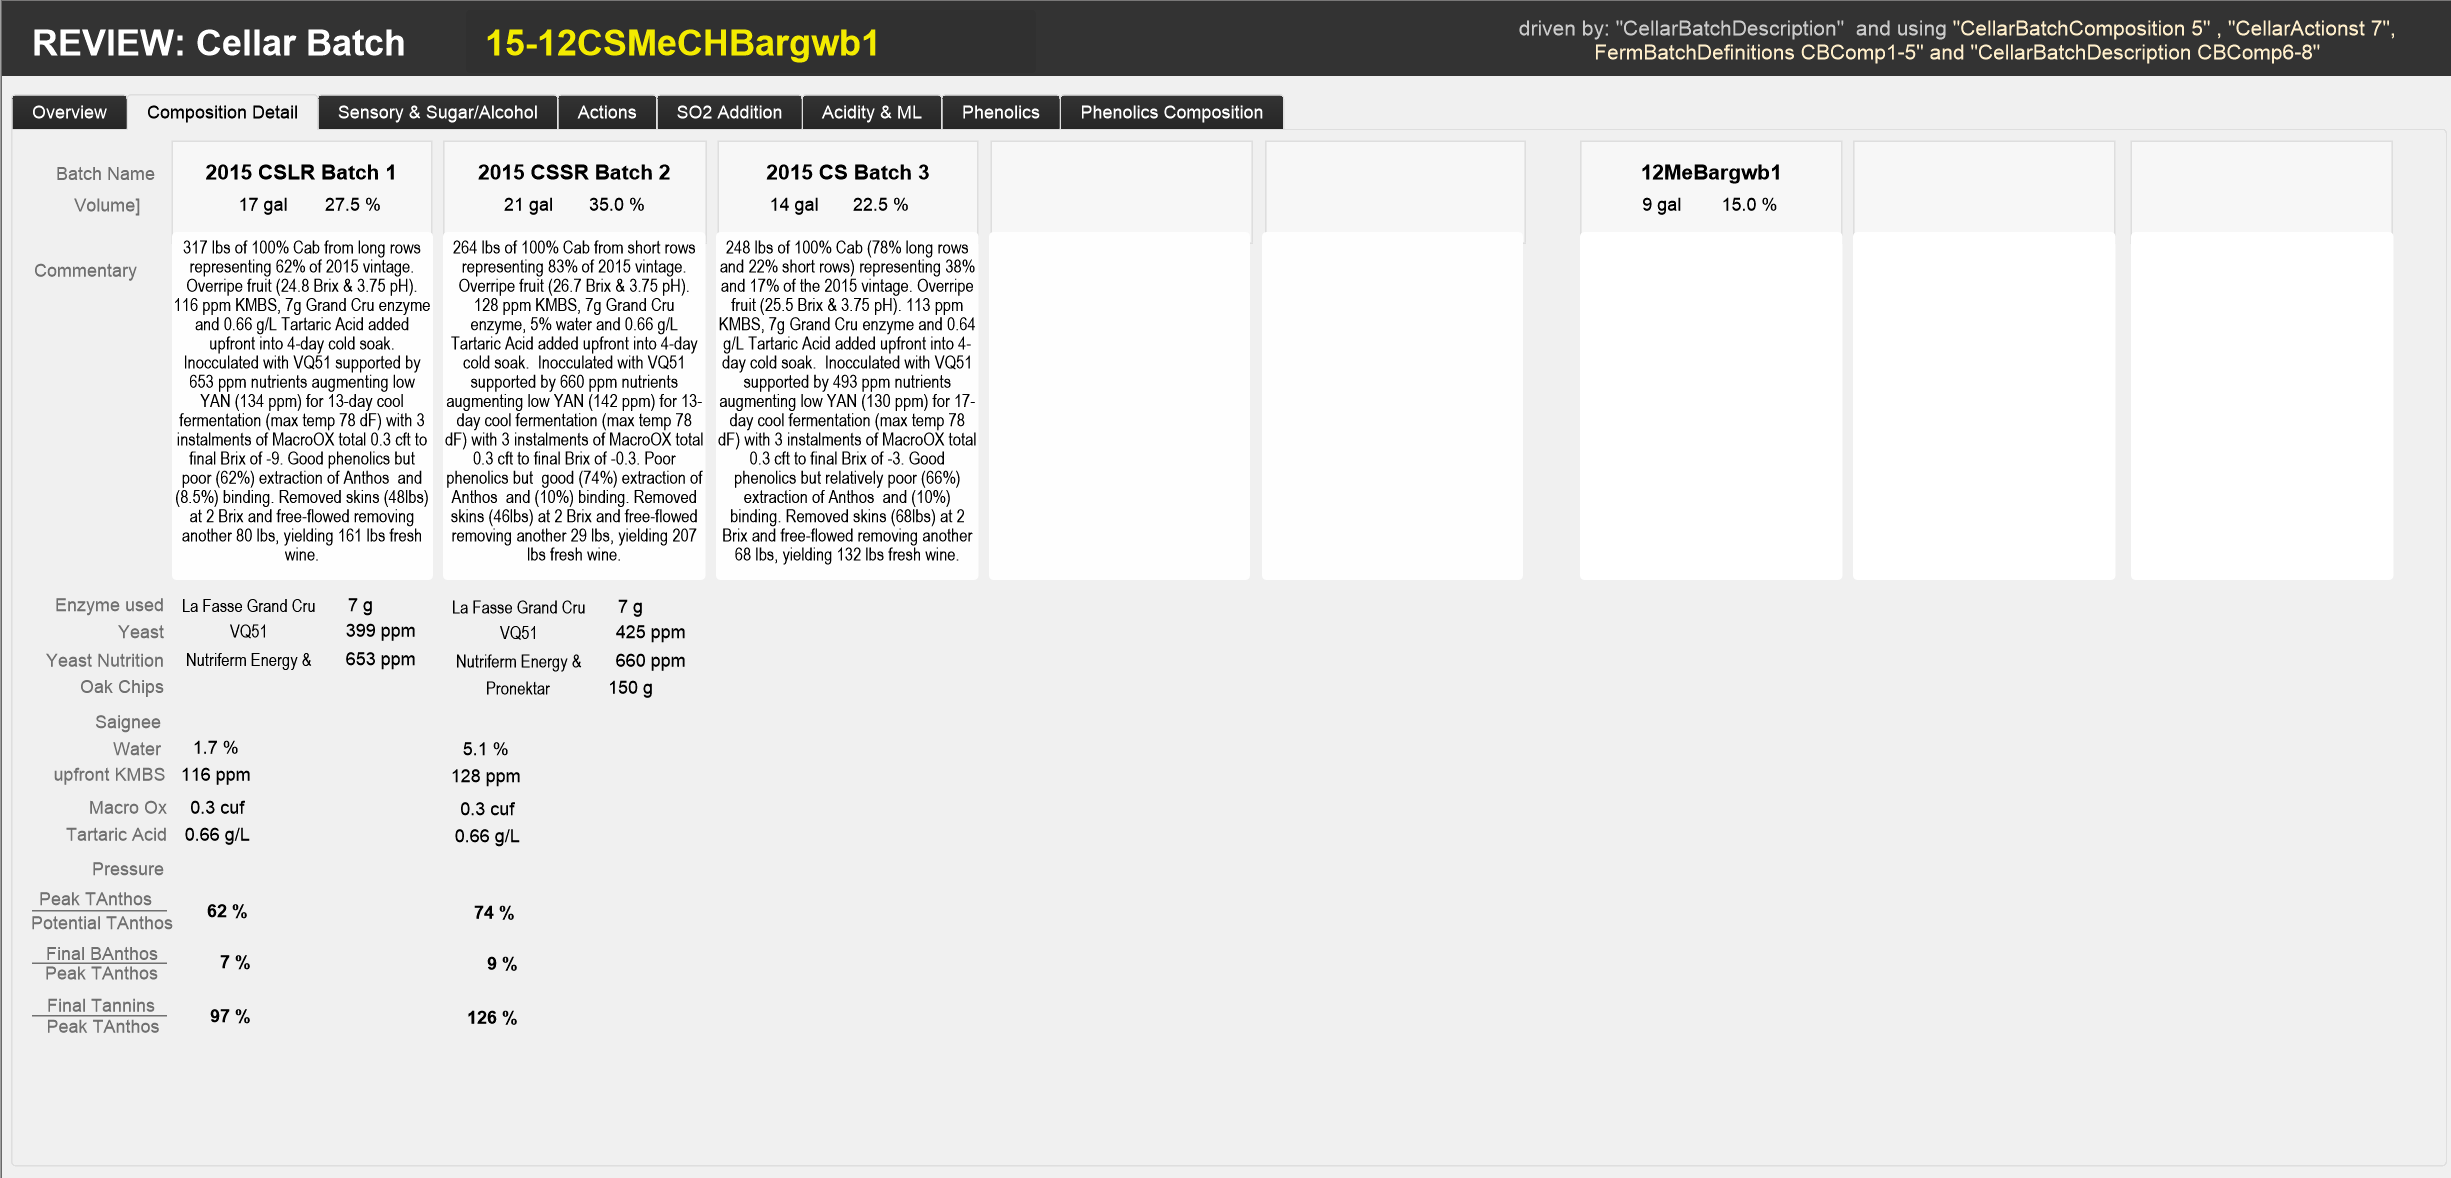
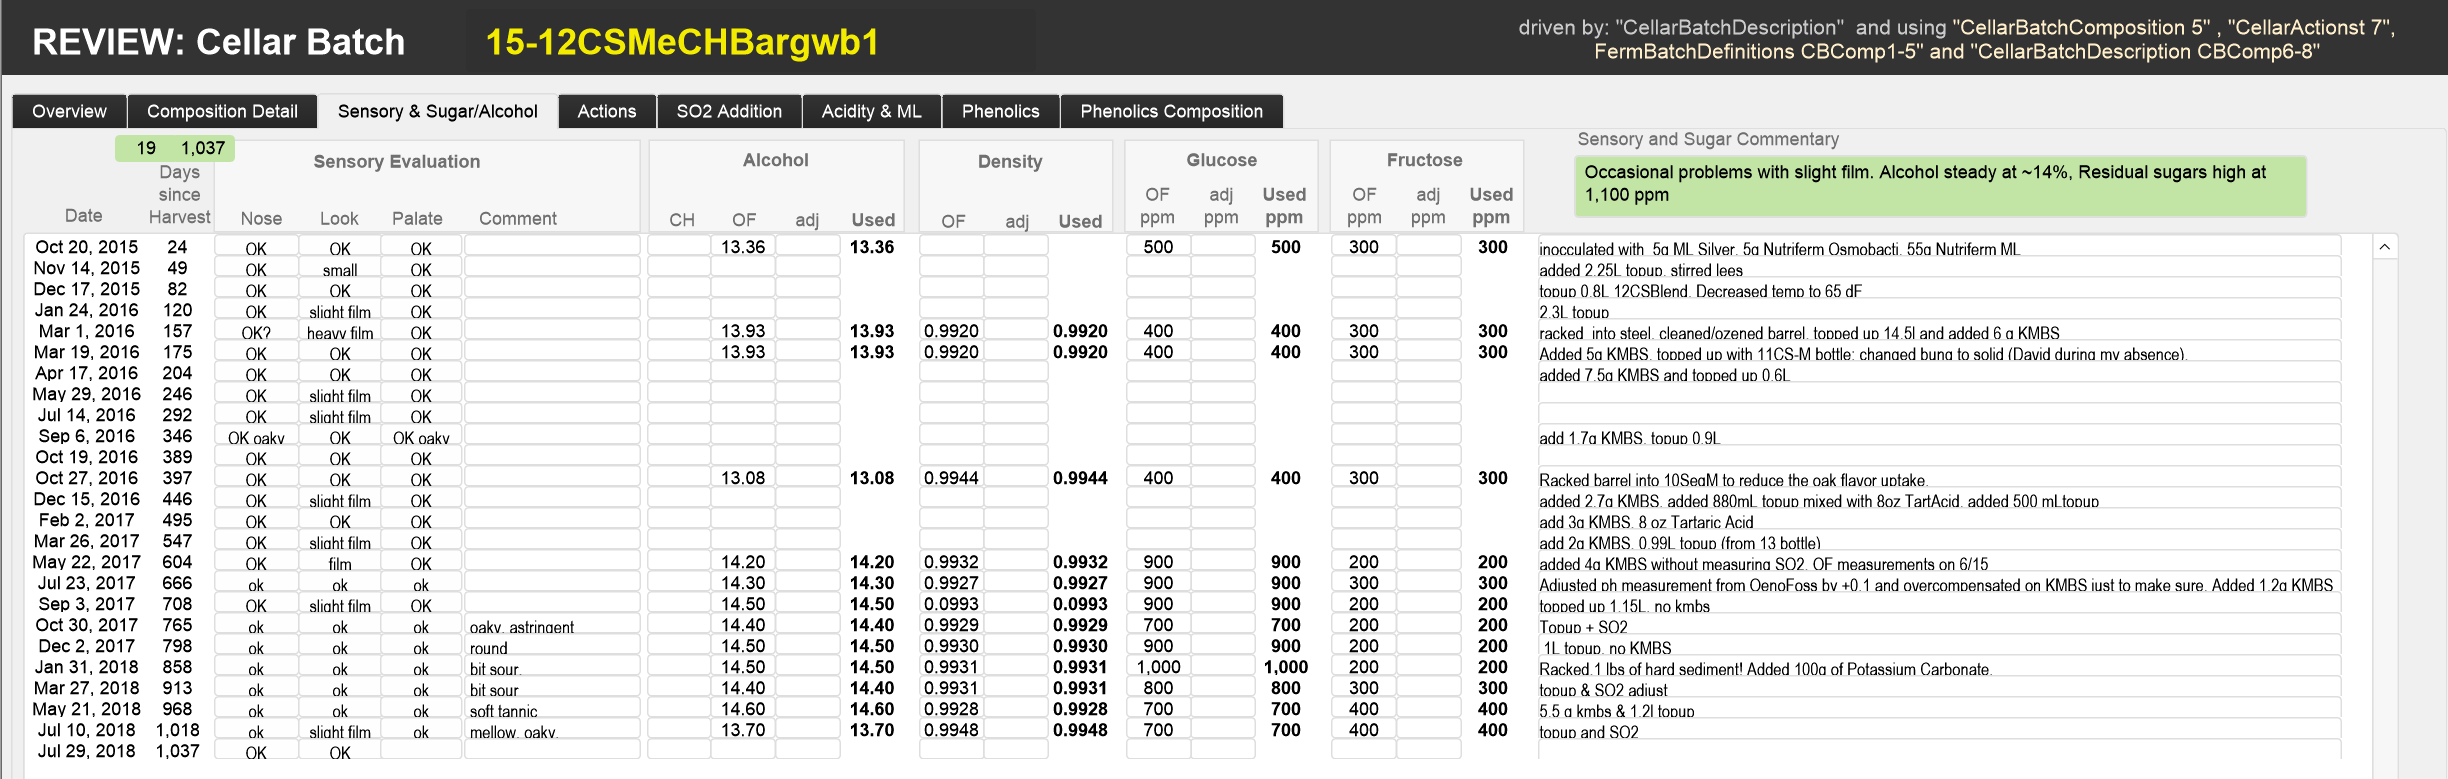
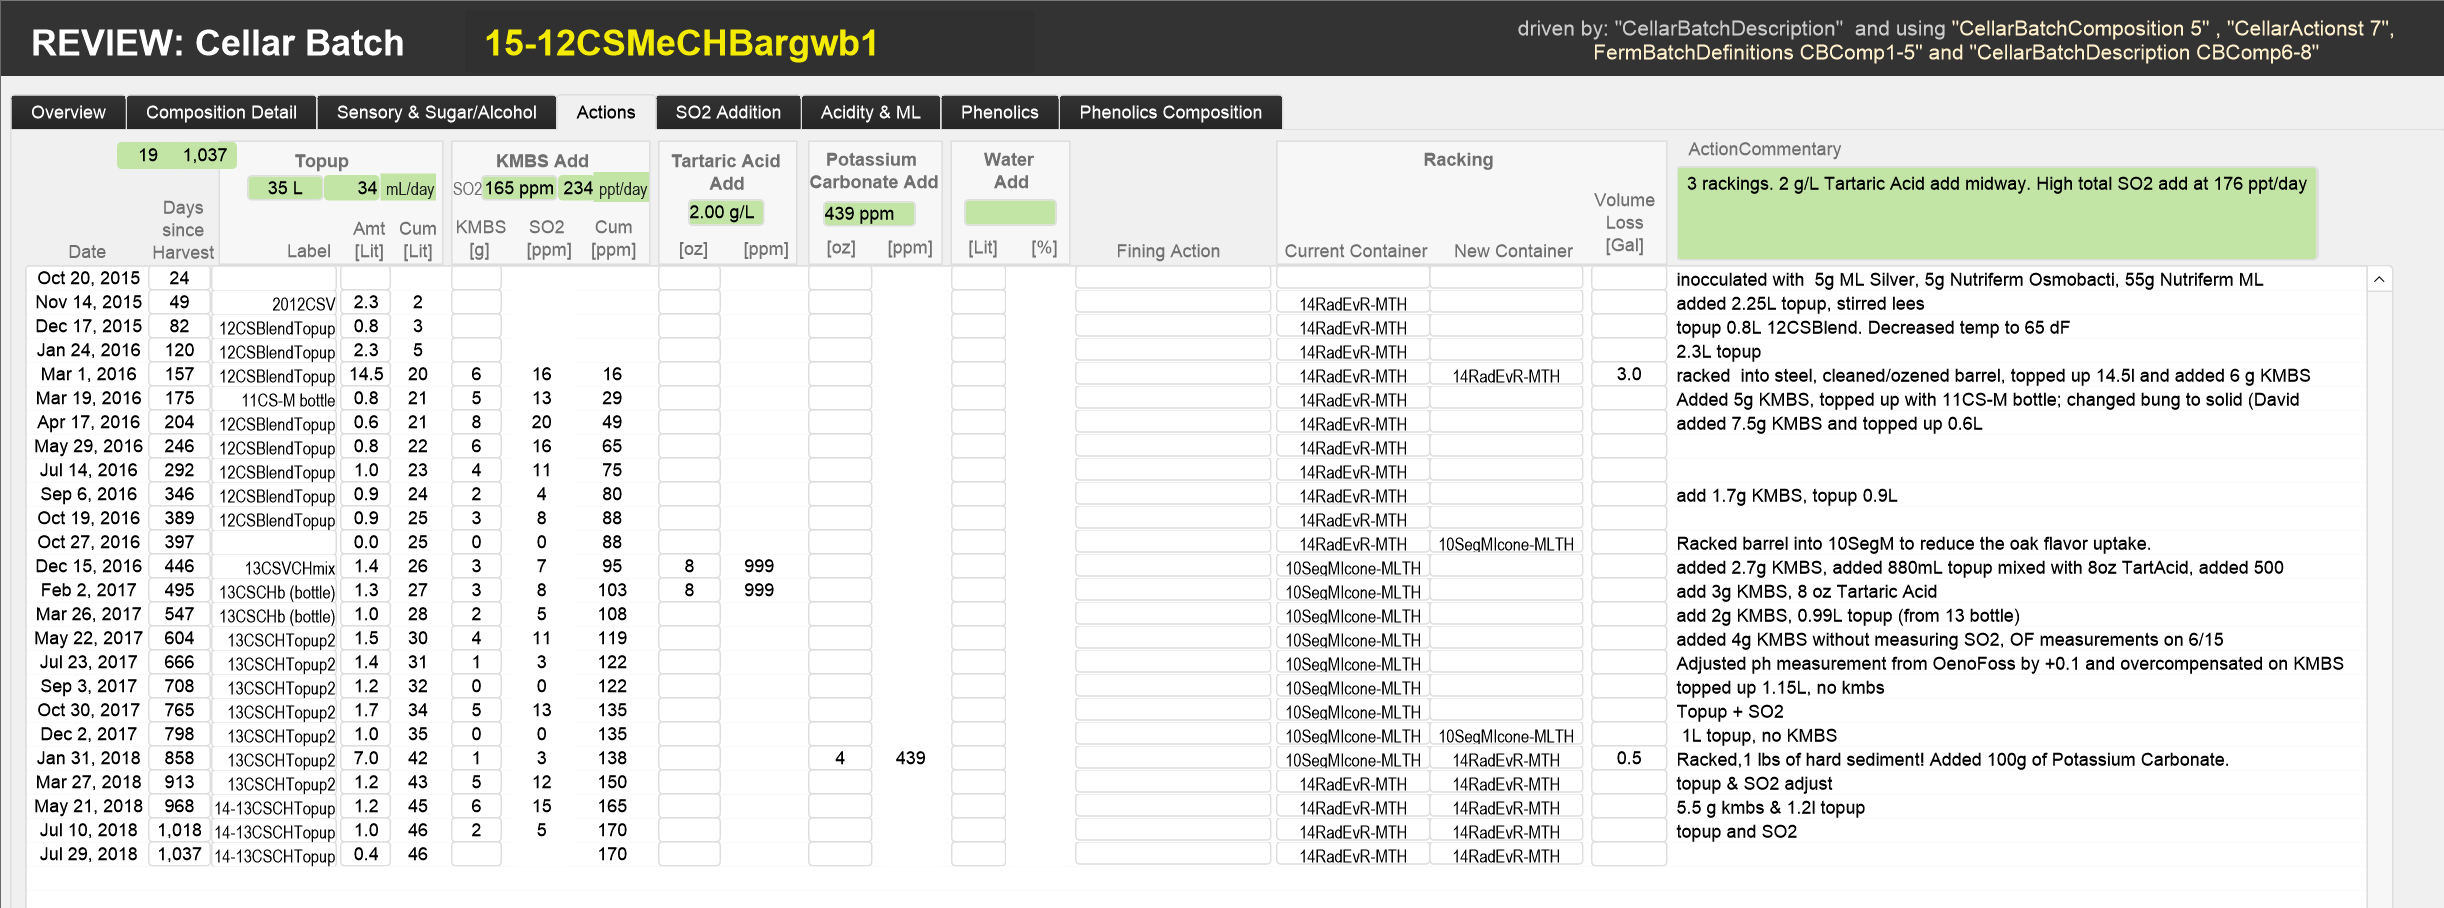
The layout has 8 tabs
- The Overview tab summarises the key data and commentaries on the cellar batch
- The Composition Detail tab provides data on the components of the cellar batch
- The Sensory & Sugar/Alcohol tab lists all sensory observations and data on sugar and alcohol
- The Actions tab lists all actions performed on the cellar batch
- The SO2 Additions tab shows all SO2 measurements and additions
- The Acidity and ML tab lists all measurements of pH, TA, VA, MA, LA as well as additions to correct the acidity or induce malolactic fermentation.
- The Phenolics tab shows all measurements of anthocyanins, tannins and total phenolics
- The Phenolics composition tab shows the evolution of phenolic measures in the cellar batch’s components.
The following screenshots show the different tabs for the 15-12CSMeCHBargwb1 batch. Note, as of this writing this batch is still maturing in the cellar. Thus the final commentary is yet to be written. We did not include screenshots of the layouts with field names as we are still refining this report.
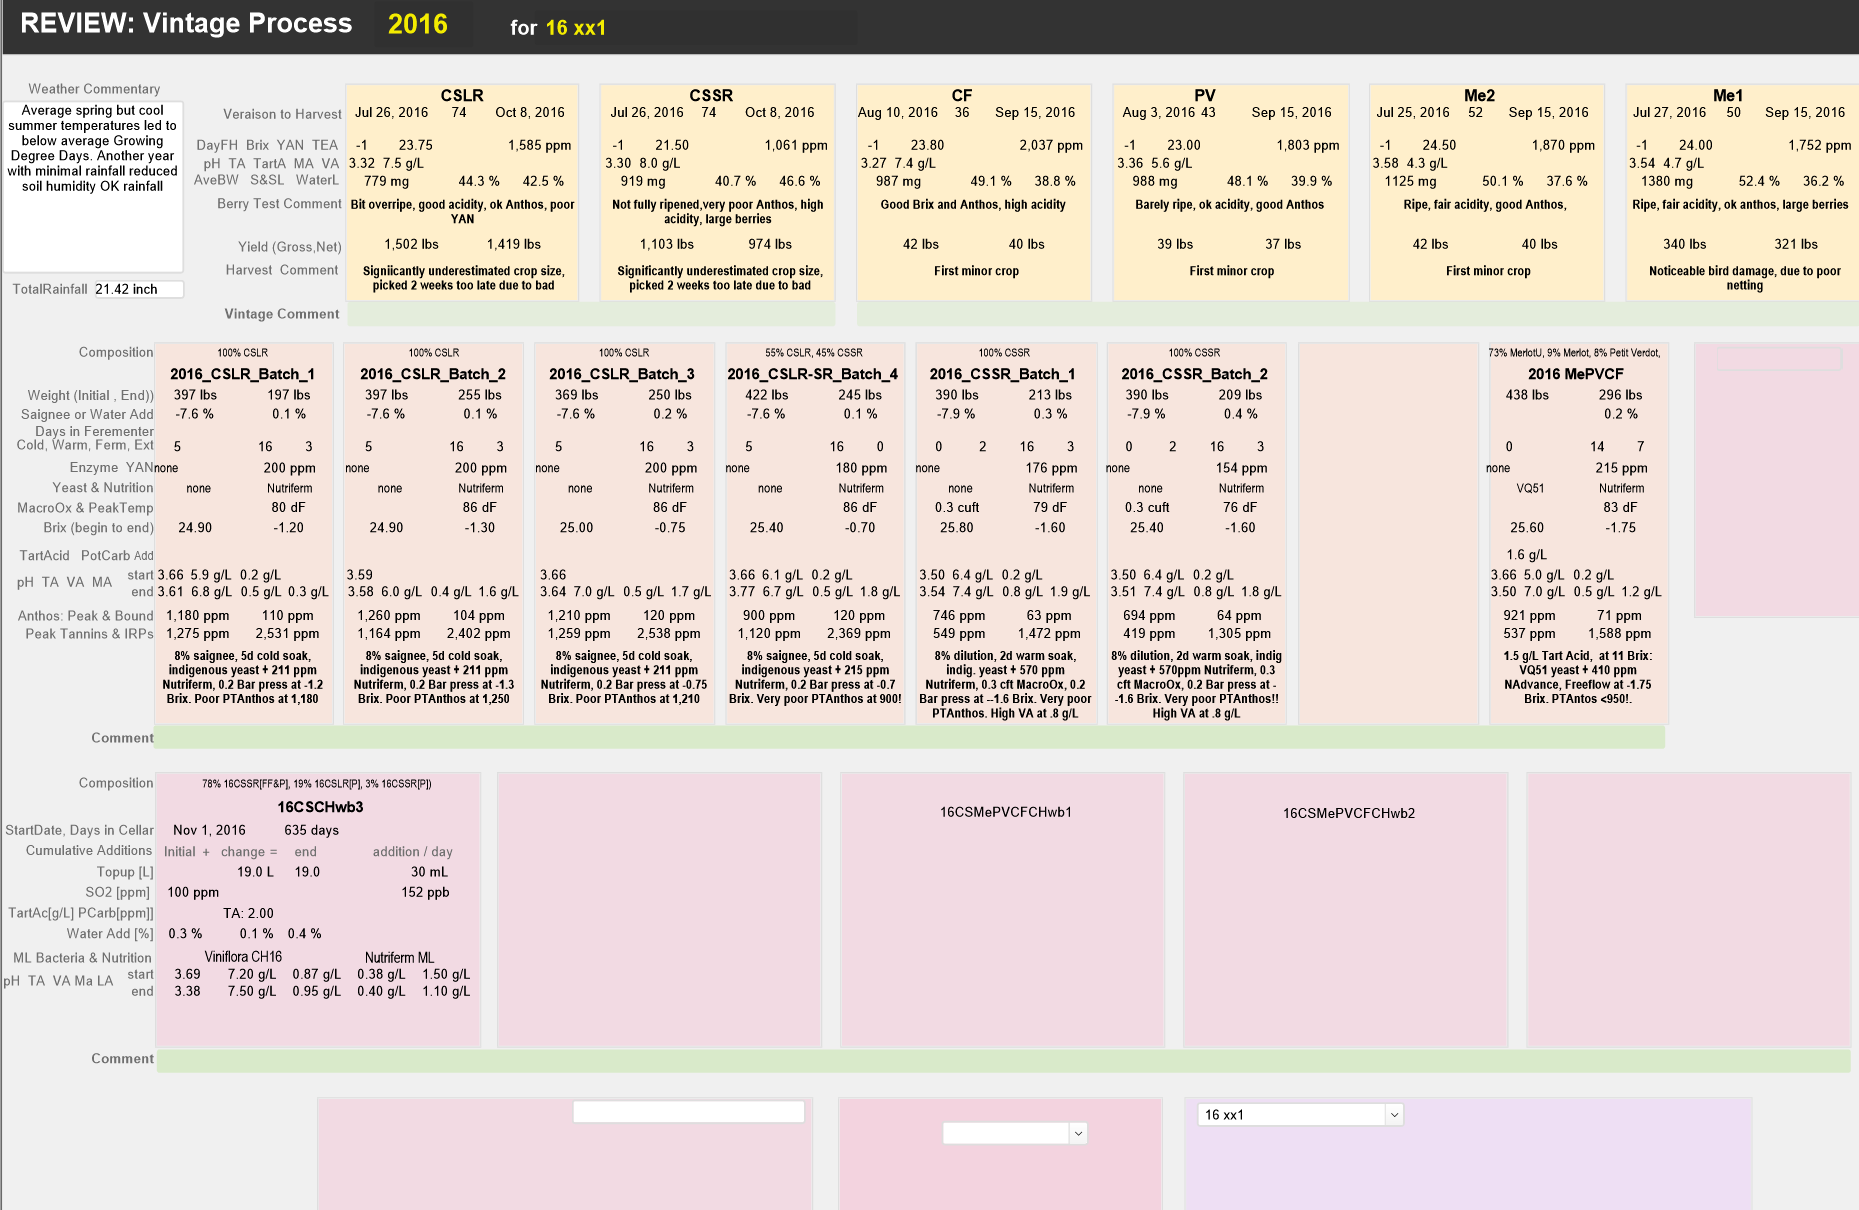
REVIEW: Vintage Processes
The REVIEW: Vintage Process layout is our first attempt to pull all the data together on what is in a specific bottle. We know which cellar batches were combined in the bottle. In turn, we know which fermentation batches contributed to each cellar batch. In turn, again, we know which fermentation batches contributed to each cellar batch. Moreover, finally, we know which harvest blocks contributed to each fermentation batch and what the weather conditions were for these blocks during the vintage year.
The following screenshot shows this tree of contributions to a not yet bottled 2016 vintage. This layout is not yet complete, but it provides a glimpse of the depth of data we can ultimately pull together on what is in a specific bottle.
Previous page: Layouts to input data
Top of this page: Go
Next Page: Home
Last updated: August 5, 2018